PERT Analysis: The following represents a project with four activities. All times are in weeks. Activity Immediate Predecessor Optimistic Time Most Likely Time Pessimistic Time A -...
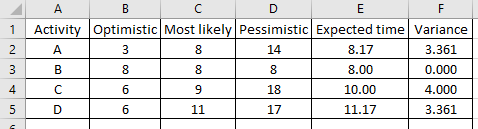
PERT Analysis: The following represents a project with four activities. All times are in weeks.
|
Activity |
Immediate Predecessor |
Optimistic Time |
Most Likely Time |
Pessimistic Time |
|
A |
- |
3 |
8 |
14 |
|
B |
- |
8 |
8 |
8 |
|
C |
A |
6 |
9 |
18 |
|
D |
B |
6 |
11 |
17 |
According to the data in the above Table:
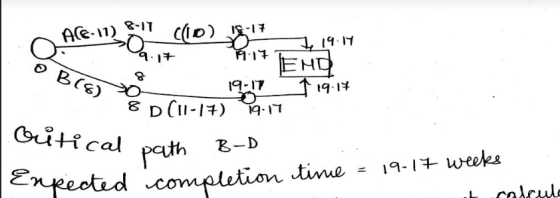
What is the critical path?
What is the minimum expected completion time for the project?
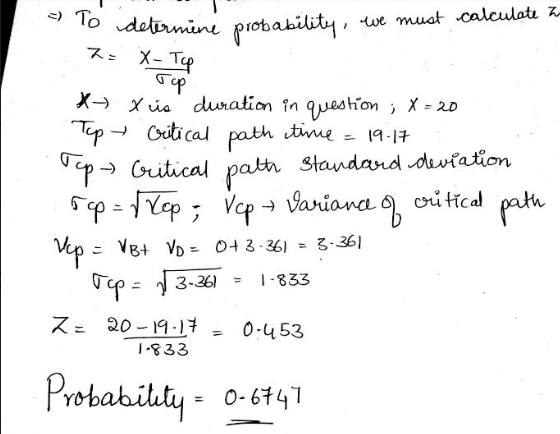
According to the above Table, there are four activities in the project. Assume the normal distribution is appropriate to use to determine the probability of finishing by a particular time. If you wished to find the probability of finishing the project in 20 weeks or fewer, it would be necessary to find the variance and then the standard deviation to be used with the normal distribution. What is the probability of completing this project in 20 weeks or fewer?
Homework Answers

Add Answer to:
PERT Analysis: The following represents a project with four activities. All times are in weeks. Activity Immediate Predecessor Optimistic Time Most Likely Time Pessimistic Time A -...
Activity Predecessor Optimistic time Most likely time Pessimistic time A - 3 5 8 B -...
Activity Predecessor Optimistic time Most likely time Pessimistic time A - 3 5 8 B - 4 6 10 C A,B 2 5 8 D B 3 5 9 E A,C 3 6 9 F C,E 1 3 5 G C,D 3 4 9 H D 4 6 10 I F,G 3 4 9 J H 2 4 6 A).Draw the project network b).what is the expected completion time of the project. c) after your calculation, if you find one...
(15 points) Activity Immediate Predecessor Optimistic Time Most likely Time Pessimistic Time A NONE 4 7...
(15 points) Activity Immediate Predecessor Optimistic Time Most likely Time Pessimistic Time A NONE 4 7 9 B A 2 4 6 C A 6 9 9 D B, C 5 5 5 E C 2 5 9 F D, E 3 3 6 Use both the longest path method and ES/EF; LS/LF method for the following questions (e) What are the slack values for non-critical activities? (4 points) (f) What is the probability that the project will be...
Pert project method Activity Predecessors A group 5 optimistic Most likely Pessimistic Expected Variance a m...
 Pert project method Activity Predecessors A group 5 optimistic Most likely Pessimistic Expected Variance a m b Time (t) o 2 3 2 1 B с D NWN mlm A 1 A,B 2 4 1 6 7 9 F 1 с с DE F,G 4 2 5 3 G 4 12 H 2 4 From the table above find the flowing answers. 1. Construct the project Network 2. Find the expected duration and Variance of each activity 3. Find the...
The table below gives the optimistic, most-likely, and pessimistic time estimates (in weeks) for all activities in a project. (Statistical tables are available in appendix I) Activ Predecessor totm t...
 The table below gives the optimistic, most-likely, and pessimistic time estimates (in weeks) for all activities in a project. (Statistical tables are available in appendix I) Activ Predecessor totm t 2.0 5.0 8.0 3.0 4.0 5.0 4.06.08.0 5.0 6.0 7.0 3.0 6.0 9.0 D, E (i) Calculate the estimated time and variance for each task (ii) Draw the AON diagram and identify the critical path. (iii) What is the expected critical path duration and estimate a standard deviation for the...
The following represents a project with known activity times. All times are in weeks. Immediate Activity...
 The following represents a project with known activity times. All times are in weeks. Immediate Activity Time Predecessor BE CD Using the data in Table above, what is the minimum possible time required for completing the project?
123) Given (Time in weeks): Activity Optimistic Most Likely Pessimistic A 3 4 5 B 6...
123) Given (Time in weeks): Activity Optimistic Most Likely Pessimistic A 3 4 5 B 6 7 14 C 2 3 10 D 6 9 12 E 4 5 12 F 1 3 11 G 1 2 9 H 2 5 8 I 1 4 7 Determine: (a) the critical path. ( HOW DO I DO THIS WITH OUT A PREDECESSOR?) (b) the probability that the project will be completed in 22 weeks.
2. Consider the network described in the table below. Immediate Activity Predecessor(s)Pessimistic Probable Optimistic 15 10...
 2. Consider the network described in the table below. Immediate Activity Predecessor(s)Pessimistic Probable Optimistic 15 10 8 K 9 8 7 L 10 6 5 M 3 3 3 N KM 9 5 1 O KM 10 7 4 P LN 10 8 3 Draw the network diagram and answer the following questions. (a) Calculate the expected duration of each activity. (b) Calculate the expected duration and variance of the critical path. (c) Calculate the probability that the project will...
Consider the network described in the table below. Activity Immediate Predecessor(s) Pessimistic Probable Optimistic J --...
Consider the network described in the table below. Activity Immediate Predecessor(s) Pessimistic Probable Optimistic J -- 15 10 8 K -- 9 8 7 L J 10 6 5 M J 3 3 3 N K, M 9 5 1 O K, M 10 7 4 P L, N 10 8 3 Draw the network diagram and answer the following questions. (a) Calculate the expected duration of each activity. (b) Calculate the expected duration and variance of the critical path....
The following represent activities in Marc Massoud's Construction Company project: Activity Immediate Predecessor(s) Time (weeks) Activity...
 The following represent activities in Marc Massoud's Construction Company project: Activity Immediate Predecessor(s) Time (weeks) Activity Immediate Predecessor(s) Time (weeks) = C, E WLUI WNVN = n a a) Choose the correct network to represent this situation. OA. OB b) The critical path is B-E-F-H c) The length of the critical path is . weeks.
The estimated times and immediate predecessors for the activities in a project at Caesar Douglas’s screening...
The estimated times and immediate predecessors for the activities in a project at Caesar Douglas’s screening company are given in the following table. Assume that the activity times are independent. All times are in weeks. Activity Predecessors Optimistic Time (a) Most Likely Time (m) Pessimistic Time (b) A -- 9 10 11 B -- 4 10 16 C A 9 10 11 D B 5 8 11 What is the critical path based on expected times? You may use any...
 Pert project method Activity Predecessors A group 5 optimistic Most likely Pessimistic Expected Variance a m b Time (t) o 2 3 2 1 B с D NWN mlm A 1 A,B 2 4 1 6 7 9 F 1 с с DE F,G 4 2 5 3 G 4 12 H 2 4 From the table above find the flowing answers. 1. Construct the project Network 2. Find the expected duration and Variance of each activity 3. Find the...
 The table below gives the optimistic, most-likely, and pessimistic time estimates (in weeks) for all activities in a project. (Statistical tables are available in appendix I) Activ Predecessor totm t 2.0 5.0 8.0 3.0 4.0 5.0 4.06.08.0 5.0 6.0 7.0 3.0 6.0 9.0 D, E (i) Calculate the estimated time and variance for each task (ii) Draw the AON diagram and identify the critical path. (iii) What is the expected critical path duration and estimate a standard deviation for the...
 The following represents a project with known activity times. All times are in weeks. Immediate Activity Time Predecessor BE CD Using the data in Table above, what is the minimum possible time required for completing the project?
 2. Consider the network described in the table below. Immediate Activity Predecessor(s)Pessimistic Probable Optimistic 15 10 8 K 9 8 7 L 10 6 5 M 3 3 3 N KM 9 5 1 O KM 10 7 4 P LN 10 8 3 Draw the network diagram and answer the following questions. (a) Calculate the expected duration of each activity. (b) Calculate the expected duration and variance of the critical path. (c) Calculate the probability that the project will...
 The following represent activities in Marc Massoud's Construction Company project: Activity Immediate Predecessor(s) Time (weeks) Activity Immediate Predecessor(s) Time (weeks) = C, E WLUI WNVN = n a a) Choose the correct network to represent this situation. OA. OB b) The critical path is B-E-F-H c) The length of the critical path is . weeks.
Most questions answered within 3 hours.
-
The following results were obtained as
part of a multiple regression analysis involving 3 independent
variables:...
asked 18 minutes ago -
The time to complete a standardized exam is approximately normal
with a mean of 70 minutes...
asked 2 hours ago -
Two thousand randomly selected adults were asked whether or not
they have ever shopped on the...
asked 2 hours ago -
Estimate the diffusion coefficient for methyl phenyl sulfide in
water at 25 degrees Celcius.
asked 1 hour ago -
10.g of a certain metal absorb 40. cal of heat and the temperature
is abserved to...
asked 2 hours ago -
How many milliliters of 0.0695 M Ca( OH)
2would be required to exactly neutralize 176 mL...
asked 3 hours ago -
A telephone survey uses a random digit dialing machine to call
subjects. The random digit dialing...
asked 3 hours ago -
How can having too little or too much of a certain
protein cause problems for an...
asked 5 hours ago -
Assume a muscle has a PCSA = 20 cm2 and Lo = 12 cm. Assume it...
asked 6 hours ago -
What is the yield to maturity of a ten-year, $1,000 bond with a
5.2% coupon rate...
asked 7 hours ago -
A mass m = 5 kg is tied on one end of a rope and is...
asked 7 hours ago -
The Average sales price of single-family houses in Charlotte is
$210,000 with a standard deviation of...
asked 7 hours ago