I need help on the problems I got wrong.


Blige Inc. Comparative Income Statement For the Years Ended December 31, 2016 and 2015 2016 2015 Sales $3,829,650 $3,523,300 19,050 Sales returns and allowances 12,380 Sales $3,810,600 $3,510,920 1,249,180 Cost of goods sold 1,357,800 $2,452,800 Gross profit $2,261,740 $820,750 Selling expenses $1,018,650 598,250 Administrative expenses 699,150 Total operating expenses 1,519,900 1,616,900 Income from operations $932,900 $644,840 Other income 49,100 41,160 $686,000 $982,000 Other expense (interest) 232,000 128,000 Income before income tax $750,000 $558,000 Income tax expense 90,000 66,800 $660,000 $491,200 Net income
Blige Inc. Comparative Balance Sheet December 31, 2016 and 2015 Dec. 31, 2016 Dec. 31, 2015 Assets Current assets $732,880 Cash $479,860 726,270 Temporary investments 1,214,480 678,900 635,100 Accounts receivable (net) Inventories 511,000 394,200 Prepaid expenses 90,778 146,580 Total current assets $2,486,808 $3,123,240 Long-term investments 2,777,612 1,623,412 Property, plant, and equipment (net) 3,190,000 2,871,000 $8,454,420 $7,617,652 Total assets Liabilities Current liabilities $857,520 $1,914,552 Long-term liabilities Mortgage note payable, 8%, due 2021 $1,300,000 $0 Bonds payable, 8%, due 2017 1,600,000 1,600,000 Total long-term liabilities $2,900,000 $1,600,000 Total liabilities $3,757,520 $3,514,552 Stockholders' Equity $600,000 $600,000 Preferred $0.7 stock, $50 par 680,000 Common stock, $10 par 680,000 Retained earnings 3,416,900 2,823,100 Total stockholders' equity $4,696,900 $4,103,100 $8,454,420 $7,617,652 Total liabilities and stockholders' equity
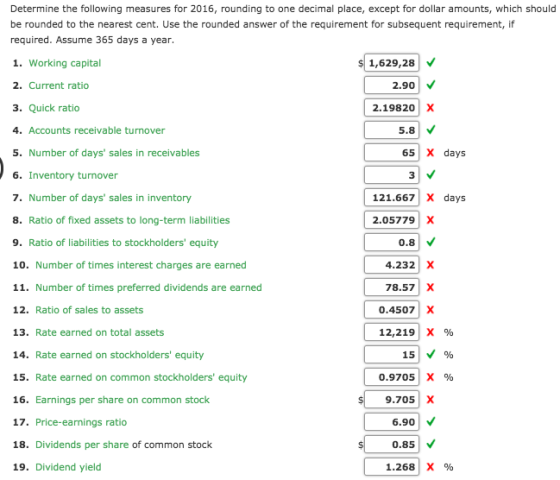
Determine the following measures for 2016, rounding to one decimal place, except for dollar amounts, which should be rounded to the nearest cent. Use the rounded answer of the requirement for subsequent requirement, if required. Assume 365 days a year 1,629,28V 1. Working capital 2.90 2. Current ratic 3. Quick ratio 2.19820 X 4. Accounts receivable turnover 5.8 65 X days 5. Number of days' sales in receivables 6. Inventory turnover 3 7. Number of days' sales in inventory 121.667X days 8. Ratio of fixed assets to long-term liabilities 2.05779 X 0.8 9. Ratio of liabilities to stockholders' equity 10. Number of times interest charges are earned 4.232 X 11. Number of times preferred dividends are earned 78.57 X 12. Ratio of sales to assets 0.4507X 12,2191 x % 13. Rate earned on total assets 14. Rate earned on stockholders' equity 15. Rate earned on common stockholders' equity 0.9705 X % 16. Earnings per share on common stock 9.705 X 6.90 V 17. Price-earnings ratio 18. Dividends per share of common stock 0.85 1.2681 x % 19. Dividend yield
Homework Answers
Answer of Part 3:
Quick Ratio = (Current Assets – Inventories – Prepaid Expenses)
/ Current Liabilities
Quick Ratio = ($2,486,808 - $511,000 - $90,778) / $857,520
Quick Ratio = $1,885,030 / $857,520
Quick Ratio = 2.2:1
Answer of Part 5:
Accounts Receivable Turnover = 5.8 times
Number of Days Sales in receivable = 365 days / Accounts
Receivable Turnover
Number of Days Sales in receivable = 365 / 5.8
Number of Days Sales in receivable = 62.9 or 63
days
Answer of Part 7:
Inventory Turnover = 3 times
Number of Days Sales in Inventory = 365 days / Inventory
Turnover
Number of Days Sales in Inventory = 365 / 3
Number of Days Sales in Inventory = 121.7 days
Answer of Part 8:
Fixed Assets = $3,190,000
Ratio of Fixed Assets to long term liabilities = Fixed Assets /
Long term Liabilities
Ratio of Fixed Assets to long term liabilities = $3,190,000 /
$2,900,000
Ratio of Fixed Assets to long term liabilities =
1.1
Answer of Part 10:
Number of Times interest charges are earned = Income from
Operations / Interest Expense
Number of Times interest charges are earned = $932,900 /
$232,000
Number of Times interest charges are earned =
4.0
Add Answer to:
I need help on the problems I got wrong. The comparative financial statements of Blige Inc. are as follows. The mark...
The comparative financial statements of Blige Inc. are as follows. The market price of Blige Inc....
The comparative financial statements of Blige Inc. are as follows. The market price of Blige Inc. common stock was $55 on December 31, 2016. Blige Inc. Comparative Retained Earnings Statement For the Years Ended December 31, 2016 and 2015 2016 2015 Retained earnings, January 1 $1,029,350 $873,250 Add net income for year 224,000 178,800 Total $1,253,350 $1,052,050 Deduct dividends On preferred stock $7,700 $7,700 On common stock 15,000 15,000 Total $22,700 $22,700 Retained earnings, December 31 $1,230,650 $1,029,350 Blige Inc....
Nineteen Measures of Solvency and Profitability The comparative financial statements of Blige Inc. are as follows....
 Nineteen Measures of Solvency and Profitability The comparative financial statements of Blige Inc. are as follows. The market price of Blige Inc. common stock was $63 on December 31, 2016. Blige Inc. Comparative Retained Earnings Statement For the Years Ended December 31, 2016 and 2015 2016 2015 Retained earnings, January 1 Add net income for year $1,028,375 227,200 $873,425 178,900 $1,052,325 Total $1,255,575 Deduct dividends On preferred stock On common stock Total $7,700 16,250 $7,700 16,250 $23,950 $1,028,375 $23,950 Retained...
Nineteen Measures of Solvency and Profitability The comparative financial statements of Blige Inc. are as follows....
 Nineteen Measures of Solvency and Profitability The comparative financial statements of Blige Inc. are as follows. The market price of Blige Inc. common stock was $63 on December 31, 2016. Blige Inc. Comparative Retained Earnings Statement For the Years Ended December 31, 2016 and 2015 2016 2015 Retained earnings, January 1 $1,421,300 Add net income for year 316,800 $1,212,400 248,300 $1,460,700 $1,738,100 Total Deduct dividends On preferred stock On common stock Total $10,500 28,900 $10,500 28,900 $39,400 $39,400 Retained earnings,...
Nineteen Measures of Solvency and Profitability The comparative financial statements of Blige Inc. are as follows....
Nineteen Measures of Solvency and Profitability The comparative financial statements of Blige Inc. are as follows. The market price of Blige Inc. common stock was $64 on December 31, 2016. Blige Inc. Comparative Retained Earnings Statement For the Years Ended December 31, 2016 and 2015 2016 2015 Retained earnings, January 1 $4,221,375 $3,569,725 Add net income for year 976,800 731,200 Total $5,198,175 $4,300,925 Deduct dividends On preferred stock $12,600 $12,600 On common stock 66,950 66,950 Total $79,550 $79,550 Retained earnings,...
Nineteen Measures of Solvency and Profitability The comparative financial statements of Blige Inc. are as follows....
Nineteen Measures of Solvency and Profitability The comparative financial statements of Blige Inc. are as follows. The market price of Blige Inc. common stock was $62 on December 31, 2016. Blige Inc. Comparative Retained Earnings Statement For the Years Ended December 31, 2016 and 2015 2016 2015 Retained earnings, January 1 $3,074,900 $2,593,500 Add net income for year 720,000 531,200 Total $3,794,900 $3,124,700 Deduct dividends On preferred stock $9,100 $9,100 On common stock 40,700 40,700 Total $49,800 $49,800 Retained earnings,...
Nineteen Measures of Solvency and Profitability The comparative financial statements of Blige Inc. are as follows....
Nineteen Measures of Solvency and Profitability The comparative financial statements of Blige Inc. are as follows. The market price of Blige Inc. common stock was $64 on December 31, 2016. Blige Inc. Comparative Retained Earnings Statement For the Years Ended December 31, 2016 and 2015 2016 2015 Retained earnings, January 1 $4,221,375 $3,569,725 Add net income for year 976,800 731,200 Total $5,198,175 $4,300,925 Deduct dividends On preferred stock $12,600 $12,600 On common stock 66,950 66,950 Total $79,550 $79,550 Retained earnings,...
Calculator Nineteen Measures of Solvency and Profitability The comparative financial statements of Blige Inc. are as...
 Calculator Nineteen Measures of Solvency and Profitability The comparative financial statements of Blige Inc. are as follows. The market price of Blige Inc. common stock was $55 on December 31, 2016. Blige Inc. Comparative Retained Earnings Statement For the Years Ended December 31, 2016 and 2015 2016 2015 Retained earnings, January 1 $1,662,500 $1,403,900 Add net income for year 364,000 287,600 $1,691,500 Total $2,026,500 Deduct dividends On preferred stock $12,600 $12,600 16,400 On common stock 16,400 Total $29,000 $29,000 $1,662,500...
The comparative financial statements of Marshall Inc. are as follows. The market price of Marshall Inc....
The comparative financial statements of Marshall Inc. are as follows. The market price of Marshall Inc. common stock was $ 62 on December 31, 20Y2. Marshall Inc. Comparative Retained Earnings Statement For the Years Ended December 31, 20Y2 and 20Y1 20Y2 20Y1 Retained earnings, January 1 $ 2,805,100 $ 2,360,600 Net income 668,800 483,500 Total $ 3,473,900 $ 2,844,100 Dividends On preferred stock $ 8,400 $ 8,400 On common stock 30,600 30,600 Total dividends $ 39,000 $ 39,000...
Twenty metrics of liquidity, Solvency, and Profitability The comparative financial statements of Automotive Solutions Inc. are...
 Twenty metrics of liquidity, Solvency, and Profitability The comparative financial statements of Automotive Solutions Inc. are as follows. The market price of Automotive Solutions Inc. common stock was $61 on December 31, 2018 AUTOMOTIVE SOLUTIONS INC. Comparative Income Statement For the Years Ended December 31, 2018 and 2017 2018 2017 Sales $3,294,855 $3,035,690 Cost of goods sold (1,199,390) (1,103,440) Gross profit $2,095,465 $1,932,250 Selling expenses $(729,000) $(903,450) Administrative expenses (621,005) (530,600) Total operating expenses (1,350,005) (1,434,050) Operating income $745,450 $498,200...
 Nineteen Measures of Solvency and Profitability The comparative financial statements of Blige Inc. are as follows. The market price of Blige Inc. common stock was $63 on December 31, 2016. Blige Inc. Comparative Retained Earnings Statement For the Years Ended December 31, 2016 and 2015 2016 2015 Retained earnings, January 1 Add net income for year $1,028,375 227,200 $873,425 178,900 $1,052,325 Total $1,255,575 Deduct dividends On preferred stock On common stock Total $7,700 16,250 $7,700 16,250 $23,950 $1,028,375 $23,950 Retained...
 Nineteen Measures of Solvency and Profitability The comparative financial statements of Blige Inc. are as follows. The market price of Blige Inc. common stock was $63 on December 31, 2016. Blige Inc. Comparative Retained Earnings Statement For the Years Ended December 31, 2016 and 2015 2016 2015 Retained earnings, January 1 $1,421,300 Add net income for year 316,800 $1,212,400 248,300 $1,460,700 $1,738,100 Total Deduct dividends On preferred stock On common stock Total $10,500 28,900 $10,500 28,900 $39,400 $39,400 Retained earnings,...
 Calculator Nineteen Measures of Solvency and Profitability The comparative financial statements of Blige Inc. are as follows. The market price of Blige Inc. common stock was $55 on December 31, 2016. Blige Inc. Comparative Retained Earnings Statement For the Years Ended December 31, 2016 and 2015 2016 2015 Retained earnings, January 1 $1,662,500 $1,403,900 Add net income for year 364,000 287,600 $1,691,500 Total $2,026,500 Deduct dividends On preferred stock $12,600 $12,600 16,400 On common stock 16,400 Total $29,000 $29,000 $1,662,500...
 Twenty metrics of liquidity, Solvency, and Profitability The comparative financial statements of Automotive Solutions Inc. are as follows. The market price of Automotive Solutions Inc. common stock was $61 on December 31, 2018 AUTOMOTIVE SOLUTIONS INC. Comparative Income Statement For the Years Ended December 31, 2018 and 2017 2018 2017 Sales $3,294,855 $3,035,690 Cost of goods sold (1,199,390) (1,103,440) Gross profit $2,095,465 $1,932,250 Selling expenses $(729,000) $(903,450) Administrative expenses (621,005) (530,600) Total operating expenses (1,350,005) (1,434,050) Operating income $745,450 $498,200...
Most questions answered within 3 hours.
-
Using MARS simulator, write MIPS programs according to
the following scenarios: Receive a positive integer number...
asked 1 hour ago -
An object in front of a concave mirror has a real image that is
11.5 cm...
asked 1 hour ago -
Consider the reaction, C3 H8 + O2 --> CO2 + H2O. How many
moles of O2...
asked 3 hours ago -
You and your opponent both roll a fair die. If you both roll the
same number,...
asked 3 hours ago -
In a study of the accuracy of fast food drive-through orders,
Restaurant A had 257 accurate...
asked 3 hours ago -
Identify and describe in detail the four categories of
institutions that could be included in a...
asked 3 hours ago -
In python
class Customer:
def __init__(self, customer_id, last_name, first_name, phone_number, address):
self._customer_id = int(customer_id)
self._last_name =...
asked 3 hours ago -
What is an example of a limitation in implementing a new
ERP system and how it...
asked 3 hours ago -
In a section of 9.7cm of an artery with a radius of 2.6mm there
is a...
asked 3 hours ago -
the two carboxylic acid groups of aspartic acid have different
acidities with pKa values of 2.1...
asked 3 hours ago -
Would CuCO3 aqueous salt combined with calcium chloride
form a solid precipitate? If so, what would...
asked 3 hours ago -
How do ECM Solutions assist in embedding a culture of continuous
improvement in an organization? (Project...
asked 4 hours ago