Directions for question 3 (only ones needed) 3. First, compute the total contribution margin in year 3 given the quality...
Directions for question 3 (only ones needed)
3. First, compute the total contribution margin in year 3 given the quality costs in year 1.
- Given the information the total revenues, you must first compute the number of units sold at the new selling price.
- Use the variable costs per unit to derive the total contribution margin.
Next, compute the total contribution margin in year 3 given the quality costs in year 3.
- You will need to determine the quality costs per unit in year 1 using the Year 1 information about selling price and the percentage of revenues.
- Compute the quality costs per unit in year 3 using the same information for year 3.
- Compute the difference in quality costs, and assuming that other variable costs are constant, compute the variable costs per unit.
- Compute the total contribution margin
Quality Improvement and Profitability Objective
Gagnon Company reported the following sales and quality costs for the past four years. Assume that all quality costs are variable and that all changes in the quality cost ratios are due to a quality improvement program.
| Year | Sales Revenues | Quality Costs as a Percent of Revenues |
| 1 | $19,200,000 | 20% |
| 2 | 20,800,000 | 17 |
| 3 | 24,320,000 | 13 |
| 4 | 25,420,000 | 9 |
Required:
1. Compute the quality costs for all four years.
| Quality Cost | |
| Year 1 | $ |
| Year 2 | $ |
| Year 3 | $ |
| Year 4 | $ |
By how much did net income increase from Year 1 to Year 2
because of quality improvements?
$
By how much did net income increase from Year 2 to Year 3
because of quality improvements?
$
By how much did net income increase from Year 3 to Year 4
because of quality improvements?
$
2. The management of Gagnon Company believes it
is possible to reduce quality costs to 2 percent of sales. Assuming
sales will continue at the Year 4 level, calculate the additional
profit potential facing Gagnon.
$
Is the expectation of improving quality and reducing costs to 2
percent of sales realistic?
Yes
3. Assume that Gagnon produces one type of product,
which is sold on a bid basis. In Years 1 and 2, the average bid was
$400. In Year 1, total variable costs were $240.00 per unit. In
Year 3, competition forced the bid to drop to $320.00.
Do not round the intermediate calculations and round your final
answers to the nearest dollar.
Compute the total contribution margin in Year 3 assuming
the same quality costs as in Year 1.
$
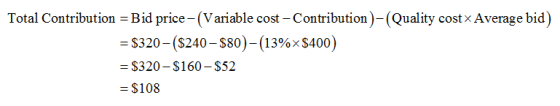
Now, compute the total contribution margin in Year 3
using the actual quality costs for Year 3.
$
What is the increase in profitability resulting from the
quality improvements made from Year 1 to Year 3?
$
Homework Answers
1.
Computation of quality costs and an increase in net profit:

Results of the excel sheet are as follows:

Note: The increase in net profit is the difference in costs as it shows the additional revenue.
2.
Computation of additional profit:

Yes, it is possible to achieve targets if the plans were implemented accurately.
3.
For year 3:
Computation of total contribution margin:

Computation of total contribution margin, using quality costs:
Computation of the increase in profitability from year 1 to year 3:

Add Answer to:
Directions for question 3 (only ones needed) 3. First, compute the total contribution margin in year 3 given the quality...
E5-19 (Algo) Calculating Contribution Margin and Contribution Ratio, Preparing Contribution Margin Income Statemen...
 E5-19 (Algo) Calculating Contribution Margin and Contribution Ratio, Preparing Contribution Margin Income Statement (LO 5-5] Riverside Inc. makes one model of wooden canoe. Partial information for it follows: 700 850 Number of Canoes Produced and Sold 500 Total costs Variable costs $ 92,500 Fixed costs 178,500 Total costs $271,000 Cost per unit Variable cost per unit $ 185.00 Fixed cost per unit 357.00 Total cost per unit $ 542.00 $129,500 178,500 $308,000 $157,250 178,500 $335, 750 $ 185.00 255.00 $...
Saved Help E5-19 (Algo) Calculating Contribution Margin and Contribution Ratio, Preparing Contribution Margin Income Statement [LO...
 Saved Help E5-19 (Algo) Calculating Contribution Margin and Contribution Ratio, Preparing Contribution Margin Income Statement [LO 5-5) 750 Riverside Inc, makes one model of wooden canoe. Partial information for it follows: Number of Canoes Produced and sold 550 900 Total costs Variable costs $115,500 $157,500 $189,000 Fixed costs 198,000 199,000 198,000 Total costs $313,500 $355,500 $387,000 Cost per unit Variable cost per unit $ 210.00 $ 210.00 $ 210.00 Fixed cost per unit 360.00 264.00 220.00 Total cost per unit...
E5-19 (Algo) Calculating Contribution Margin and Contribution Ratio, Preparing Contribution Margin Income Statement [LO 5-5] Riverside...
 E5-19 (Algo) Calculating Contribution Margin and Contribution Ratio, Preparing Contribution Margin Income Statement [LO 5-5] Riverside Inc. makes one model of wooden canoe. Partial information for it follows: 450 650 800 Number of Canoes Produced and Sold Total costs Variable costs Fixed costs Total costs Cost per unit Variable cost per unit Fixed cost per unit Total cost per unit $ 72,000 187,200 $259,200 $ 104,000 187,200 $ 291, 200 $ 128,000 187,200 $315,200 $ 160.00 416.00 $ 576.00 $...
E5-19 (Algo) Calculating Contribution Margin and Contribution Ratio, Preparing Contribution Margin Income Statement (LO 5-5) Riverside...
 E5-19 (Algo) Calculating Contribution Margin and Contribution Ratio, Preparing Contribution Margin Income Statement (LO 5-5) Riverside Inc. makes one model of wooden canoe. Partial information for it follows: 700 850 Number of Canoes Produced and sold 500 Total costs Variable costs $ 90,000 Fixed costs 119,000 Total costs $209,000 Cost per unit Variable cost per unit $ 180.00 Fixed cost per unit 238.00 Total cost per unit $ 418.00 $126,000 119,000 $245,000 $153,000 119,000 $272,000 $ 180.00 170.00 $ 350.00...
E5-16 Calculating Contribution Margin and Contribution Ratio, Preparing Contribution Margin Income Statement [LO 5-5] Riverside Inc,...
 E5-16 Calculating Contribution Margin and Contribution Ratio, Preparing Contribution Margin Income Statement [LO 5-5] Riverside Inc, makes one model of wooden canoe. Partial information for it follows: 450 650 800 Number of Canoes Produced and Sold Total costs Variable costs Fixed costs Total costs Cost per unit Variable cost per unit Fixed cost per unit Total cost per unit $ 65,250 280,800 $346,050 $ 94,250 280,800 $375,050 $ 116,000 280,800 $396,800 $ $ 145.00 624.00 $ 769.00 145.00 432.00 577.00...
E5-16 Calculating Contribution Margin and Contribution Ratio, Preparing Contribution Margin Income Statement [LO 5-5] Riverside Inc....
 E5-16 Calculating Contribution Margin and Contribution Ratio, Preparing Contribution Margin Income Statement [LO 5-5] Riverside Inc. makes one model of wooden canoe. Partial information for it follows: 550 750 900 Number of Canoes Produced and Sold Total costs Variable costs Fixed costs Total costs Cost per unit Variable cost per unit Fixed cost per unit Total cost per unit $107,250 247,500 $354,750 $ 146,250 247,500 $ 393,750 $ 175,500 247,500 $423,000 $ $ 195.00 450.00 $ 645.00 195.00 330.00 525.00...
E5-16 Calculating Contribution Margin and Contribution Ratio, Preparing Contribution Margin Income Statement [LO 5-5] Riverside Inc....
 E5-16 Calculating Contribution Margin and Contribution Ratio, Preparing Contribution Margin Income Statement [LO 5-5] Riverside Inc. makes one model of wooden canoe. Partial information for it follows: ола 500 700 850 Number of Canoes Produced and Sold Total costs Variable costs Fixed costs Total costs Cost per unit Variable cost per unit Fixed cost per unit Total cost per unit $ 87,500 178,500 $266,000 $ 122,500 178,500 $ 301,000 $ 148,750 178,500 $327,250 $ 175.00 357.00 $ 532.00 $ 175.00...
E5-16 Calculating Contribution Margin and Contribution Ratio, Preparing Contribution Margin Income Statement [LO 5-5] Riverside Inc....
 E5-16 Calculating Contribution Margin and Contribution Ratio, Preparing Contribution Margin Income Statement [LO 5-5] Riverside Inc. makes one model of wooden canoe. Partial information for it follows: Number of Canoes Produced and Sold 550 750 900 Total costs Variable costs $112.750 $ 153,750 $ 184,500 Fixed costs 148,500 148.500 148,500 Total costs $261.250 $ 302,250 $ 333,000 Cost per unit Variable cost per unit $ 205.00 $ 205.00 $ 205.00 Fixed cost per unit 270.00 198.00 165.00 Total cost per...
E5-16 Calculating Contribution Margin and Contribution Ratio, Preparing Contribution Margin Income Statement [LO 5-5] Riverside Inc....
 E5-16 Calculating Contribution Margin and Contribution Ratio, Preparing Contribution Margin Income Statement [LO 5-5] Riverside Inc. makes one model of wooden canoe. Partial information for it follows: 450 650 Number of Canoes Produced and Sold Total costs Variable costs Fixed costs Total costs Cost per unit Variable cost per unit Fixed cost per unit Total cost per unit $ 72,000 187,200 $259,200 $ 104,000 187,200 $ 291,200 800 $ 128,000 187,200 $315,200 $ $ 160.00 416.00 $ 576.00 160.00 288.00...
E5-19 (Algo) Calculating Contribution Margin and Contribution Ratio, Preparing Contribution Margin Income Statement [LO 5-5) Riverside...
 E5-19 (Algo) Calculating Contribution Margin and Contribution Ratio, Preparing Contribution Margin Income Statement [LO 5-5) Riverside Inc. makes one model of wooden canoe. Partial information for it follows: 550 750 900 Number of Canoes Produced and Sold Total costs Variable costs Fixed costs Total costs Cost per unit Variable cost per unit Fixed cost per unit Total cost per unit $107,250 247,500 $354,750 $ 146,250 247,500 $ 393,750 $175,500 247,500 $423,000 $ 195.00 450.00 $ 645.00 $ 195.00 $ 195....
 E5-19 (Algo) Calculating Contribution Margin and Contribution Ratio, Preparing Contribution Margin Income Statement (LO 5-5] Riverside Inc. makes one model of wooden canoe. Partial information for it follows: 700 850 Number of Canoes Produced and Sold 500 Total costs Variable costs $ 92,500 Fixed costs 178,500 Total costs $271,000 Cost per unit Variable cost per unit $ 185.00 Fixed cost per unit 357.00 Total cost per unit $ 542.00 $129,500 178,500 $308,000 $157,250 178,500 $335, 750 $ 185.00 255.00 $...
 Saved Help E5-19 (Algo) Calculating Contribution Margin and Contribution Ratio, Preparing Contribution Margin Income Statement [LO 5-5) 750 Riverside Inc, makes one model of wooden canoe. Partial information for it follows: Number of Canoes Produced and sold 550 900 Total costs Variable costs $115,500 $157,500 $189,000 Fixed costs 198,000 199,000 198,000 Total costs $313,500 $355,500 $387,000 Cost per unit Variable cost per unit $ 210.00 $ 210.00 $ 210.00 Fixed cost per unit 360.00 264.00 220.00 Total cost per unit...
 E5-19 (Algo) Calculating Contribution Margin and Contribution Ratio, Preparing Contribution Margin Income Statement [LO 5-5] Riverside Inc. makes one model of wooden canoe. Partial information for it follows: 450 650 800 Number of Canoes Produced and Sold Total costs Variable costs Fixed costs Total costs Cost per unit Variable cost per unit Fixed cost per unit Total cost per unit $ 72,000 187,200 $259,200 $ 104,000 187,200 $ 291, 200 $ 128,000 187,200 $315,200 $ 160.00 416.00 $ 576.00 $...
 E5-19 (Algo) Calculating Contribution Margin and Contribution Ratio, Preparing Contribution Margin Income Statement (LO 5-5) Riverside Inc. makes one model of wooden canoe. Partial information for it follows: 700 850 Number of Canoes Produced and sold 500 Total costs Variable costs $ 90,000 Fixed costs 119,000 Total costs $209,000 Cost per unit Variable cost per unit $ 180.00 Fixed cost per unit 238.00 Total cost per unit $ 418.00 $126,000 119,000 $245,000 $153,000 119,000 $272,000 $ 180.00 170.00 $ 350.00...
 E5-16 Calculating Contribution Margin and Contribution Ratio, Preparing Contribution Margin Income Statement [LO 5-5] Riverside Inc, makes one model of wooden canoe. Partial information for it follows: 450 650 800 Number of Canoes Produced and Sold Total costs Variable costs Fixed costs Total costs Cost per unit Variable cost per unit Fixed cost per unit Total cost per unit $ 65,250 280,800 $346,050 $ 94,250 280,800 $375,050 $ 116,000 280,800 $396,800 $ $ 145.00 624.00 $ 769.00 145.00 432.00 577.00...
 E5-16 Calculating Contribution Margin and Contribution Ratio, Preparing Contribution Margin Income Statement [LO 5-5] Riverside Inc. makes one model of wooden canoe. Partial information for it follows: 550 750 900 Number of Canoes Produced and Sold Total costs Variable costs Fixed costs Total costs Cost per unit Variable cost per unit Fixed cost per unit Total cost per unit $107,250 247,500 $354,750 $ 146,250 247,500 $ 393,750 $ 175,500 247,500 $423,000 $ $ 195.00 450.00 $ 645.00 195.00 330.00 525.00...
 E5-16 Calculating Contribution Margin and Contribution Ratio, Preparing Contribution Margin Income Statement [LO 5-5] Riverside Inc. makes one model of wooden canoe. Partial information for it follows: ола 500 700 850 Number of Canoes Produced and Sold Total costs Variable costs Fixed costs Total costs Cost per unit Variable cost per unit Fixed cost per unit Total cost per unit $ 87,500 178,500 $266,000 $ 122,500 178,500 $ 301,000 $ 148,750 178,500 $327,250 $ 175.00 357.00 $ 532.00 $ 175.00...
 E5-16 Calculating Contribution Margin and Contribution Ratio, Preparing Contribution Margin Income Statement [LO 5-5] Riverside Inc. makes one model of wooden canoe. Partial information for it follows: Number of Canoes Produced and Sold 550 750 900 Total costs Variable costs $112.750 $ 153,750 $ 184,500 Fixed costs 148,500 148.500 148,500 Total costs $261.250 $ 302,250 $ 333,000 Cost per unit Variable cost per unit $ 205.00 $ 205.00 $ 205.00 Fixed cost per unit 270.00 198.00 165.00 Total cost per...
 E5-16 Calculating Contribution Margin and Contribution Ratio, Preparing Contribution Margin Income Statement [LO 5-5] Riverside Inc. makes one model of wooden canoe. Partial information for it follows: 450 650 Number of Canoes Produced and Sold Total costs Variable costs Fixed costs Total costs Cost per unit Variable cost per unit Fixed cost per unit Total cost per unit $ 72,000 187,200 $259,200 $ 104,000 187,200 $ 291,200 800 $ 128,000 187,200 $315,200 $ $ 160.00 416.00 $ 576.00 160.00 288.00...
 E5-19 (Algo) Calculating Contribution Margin and Contribution Ratio, Preparing Contribution Margin Income Statement [LO 5-5) Riverside Inc. makes one model of wooden canoe. Partial information for it follows: 550 750 900 Number of Canoes Produced and Sold Total costs Variable costs Fixed costs Total costs Cost per unit Variable cost per unit Fixed cost per unit Total cost per unit $107,250 247,500 $354,750 $ 146,250 247,500 $ 393,750 $175,500 247,500 $423,000 $ 195.00 450.00 $ 645.00 $ 195.00 $ 195....
Most questions answered within 3 hours.
-
A manufacturing company preparing to build a new plant is
considering three potential locations for it....
asked 28 minutes ago -
A .15kg rubber ball is bounced off a wall. Before hitting the
wall, the ball moves...
asked 26 minutes ago -
B. If compound Y has approximately the same values of solubility
in toluene as compound X,...
asked 1 hour ago -
Oscar Inc. has inventory in Japan valued at 39,051,000 Yen one
year ago. One year ago...
asked 1 hour ago -
If Canada suffered from "fundamental disequilibrium," and its
government choose not to devalue its currency, a...
asked 1 hour ago -
4. How many input & output Key Value Pairs are passed into,
and emitted out of...
asked 1 hour ago -
Why would your heart not function well if constructed of
skeletal muscle? What is the particular...
asked 1 hour ago -
Please respond to this essay question in full essay form for
Chemistry 1102 Organic and Biochemistry:...
asked 1 hour ago -
Determine the head loss and velocity of flow in a water supply main
of 15.0 cm...
asked 1 hour ago -
A marketing executive who knowingly authorizes a shoddy
defective product to be brought to market is...
asked 1 hour ago -
Write a psudocode:
1. Define a function called authorize that takes in 2 strings,
uName, and...
asked 1 hour ago -
What Hall voltage (in mV) is produced by a 0.180 T field applied
across a 2.60...
asked 1 hour ago