PLEASE HELPING ON EXERCISE 4! THANK YOU!

RELATED PROBLEMS:
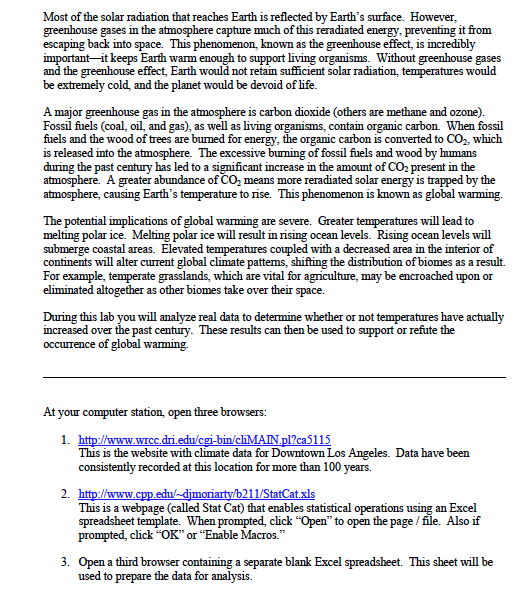

Most of the solar radiation that reaches Earth is reflected by Earth's surface. However, greenhouse gases in the atmosphere capture much of this reradiated energy, preventing it from escaping back into space. This phenomenon, known as the greenhouse effect, is incredibly important-it keeps Earth warm enough to support living organisms. Without greenhouse gases and the greenhouse effect, Earth would not retain sufficient solar radiation, temperatures would be extremely cold, and the planet would be devoid of life A major greenhouse gas in the atmosphere is carbon dioxide (others are methane and ozone). Fossil fuels (coal, oil, and gas), as well as living organisms, contain organic carbon When fossil fuels and the wood of trees are burned for energy, the organic carbon is converted to CO2, which is released into the atmosphere. The excessive burning of fossil fuels and wood by humans during the past century has led to a significant increase in the amount of CO2 present in the atmosphere. A greater abundance of CO2 means more reradiated solar energy is trapped by the atmosphere, causing Earth's temperature to rise. This phenomenon is known as global warming. The potential implications of global warming are severe. Greater temperatures will lead to melting polar ice. Melting polar ice will result in rising ocean levels. Rising ocean levels will submerge coastal areas. Elevated temperatures coupled with a decreased area in the interior of continents will alter current global climate pattems, shifting the distribution of biomes as a result. For example, temperate grasslands, which are vital for agriculture, may be encroached upon or eliminated altogether as other biomes take over their space. During this lab you will analyze real data to determine whether or not temperatures have actually increased over the past century. These results can then be used to support or refute the occuurence of global warming. At your computer station, open three browsers: 1. http://www.wrcc.dri ed/cgi-bin/cliMANpl?ca5115 This is the website with climate data for Downtown Los Angeles. Data have been consistently recorded at this location for more than 100 years. http://www.cpp.edu/d This is a webpage (called Stat Cat) that enables statistical operations using an Excel spreadsheet template. When prompted, click "OK" or "Enable Macros. b211/StatCat prompted, click "Open" to open the page /file. Also if 3. Open a third browser containing a separate blank Excel spreadsheet. This sheet will be used to prepare the data for analysis.
Within the left column of the Downtown Los Angeles webpage, click on tbe link for average monthly temperatures. This can be found umder the section headed "Period of Record." From there, it is located under the "Temperature" category and Monthly Temperature Listings. Though the data actually go back to 1877, you will work with the period from 1916 to 2015 (exactly 100 years). Highlight all of the data (years, monthly averages, and anmal averages) from 1916 to 2015. Copy and paste these data into Sheet 1 of your blank Excel file You will now work with just the average anmal temperatures (the last columm of data). The data will be divided into four 25-year time periods (1916 to 1940, 1941 to 1965, 1966 to 1990, and 1991 to 2015). Highlight the average anmual temnperatures (the last column of data in Sheet I) from 1916 to 1940. Copy and paste these data into the first column (colunm A) of Sheet 2 in your Excel file. Highlight the average anmual temnperatures for the remaining three time periods (1941 to 1965 1966 to 1990, 1991 to 2015) and copy paste the data into columns B, C, and D, respectively of Sheet 2 in your Excel file. You should now have four columns of data, each with 25 values representing the average anual tenperatures for the different time periods of the past century As there are four sanmples of data, ANOVA is the appropriate statistical test to use to deternnine any potential differences in the data In Stat Cat, click on the Mnltiple sample 1-Factor tab. This woiksheet perfoms ANOVA data analysis. Copy and paste the four colunns of data from Sheet 2 of Excel into the first four columms of Stat Cat (under Group 1, Group 2, Group 3, and Group 4, beginning with row l). Click the Calculate Worksbeef button at the top of the page Above each group is its mean (as well as its standard deviation and sample size; be sure each samle siz e is 25). At the top left ofthe page is a table titled ANOVA.” At the bottom right of hat table is the p-value. 1. What are the means for each of the four time periods? 1916-1940 1941 1965 1966-1990 1991-2015: 2. What is the p-value for these data? 3. What does the p-value tell you? In other words, is there a significant difference in average anmal temperature among these four time periods? Keep the nll and alternative bypotheses of ANOVA in mind when answering these questions. 4. If there is a significant difference, what is the difference? Use the means to answer this queston
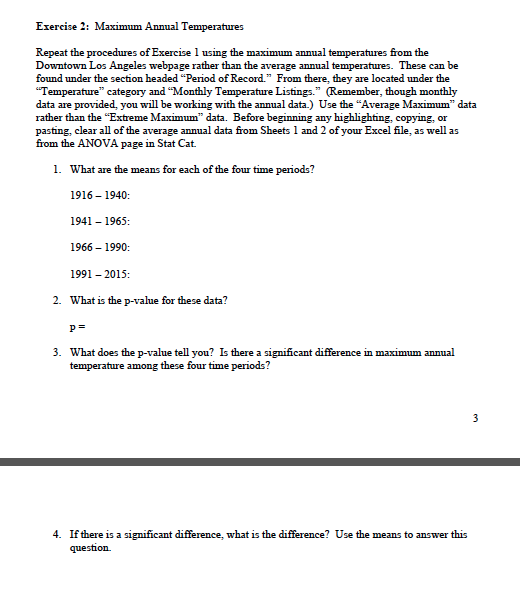
Erercise 2: Maximum Annual Temperatures Repeat the procedures of Exercise 1 using the maximum annual temperatures from the Downtown Los Angeles webpage rather than the average annual temperatures. These can be found under the section headed "Period of Record." From there, they are located under the Temperature category and "Monthly Temperature Listings. (Remember, though monthly data are provided, you will be working with the annual data.) Use the "Average Maximum" data rather than the "Extreme Maximum" data. Before beginning any highlighting, copying, or pasting, clear all of the average annual data from Sheets 1 and 2 of your Excel file, as well as from the ANOVA page in Stat Cat. . What are the means for each of the four time periods? 1916 1940: 1941 1965: 1966 1990: 1991 2015 2. What is the p-value for these data? 3. What does the p-value tell you? Is there a significant difference in maximum annual temperature among these four time periods? 4. Ifthere is a significant difference, what is the difference? Use the means to answer this question.
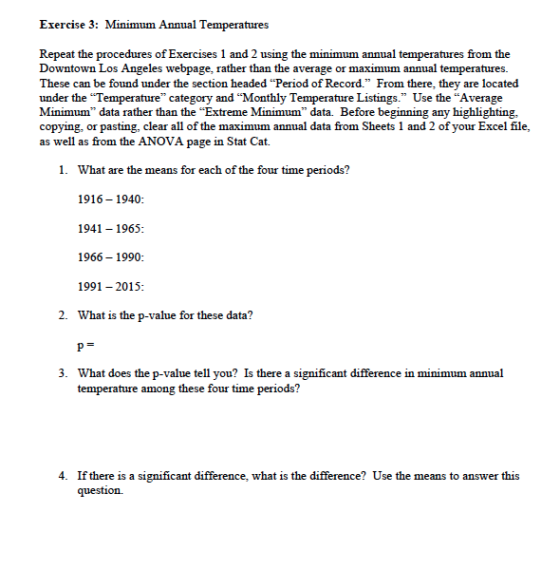
Exercise 3: Minimum Annual Temperatures Repeat the procedures of Exercises 1 and 2 using the minimum annual temperatures from the Downtown Los Angeles webpage, rather than the average or maximum annual temperatures. These can be found under the section headed "Period of Record." From there, they are located under the Temperature" category and "Monthly Temperature Listings." Use the "Average Minimum" data rather than the "Extreme Minimum" data. Before beginning any highlighting, copying, or pasting, clear all of the maximum annual data from Sheets 1 and 2 of your Excel file, as well as from the ANOVA page in Stat Cat. 1. What are the means for each of the four time periods? 1916-1940: 1941 1965: 1966-1990: 1991 - 2015: 2. What is the p-value for these data? 3. What does the p-value tell you? Is there a significant difference in minimum annual temperature among these four time periods? 4. If there is a significant difference, what is the difference? Use the means to answer this
Homework Answers
- To be clear, the data is represented in the format indicating the time period from 1877-2016 and not on an annual basis. It is basically given as an average and hence mean value for determination of p-value needs to be calculated from this average.
- So, the overall mean for an year comes to around 64.88. (57.3, 58.4, 60, 62.2, 64.7, 68.3, 72.7, 73.4, 72.3, 68.1, 63, 58.2) The sum divided by total number of months corresponds to the mean value given above.
- Next step is determining the Standard deviation. This can be found out by the formula:- SD = sqrt [ (1/N) summation of (xi-u)2
- The standard deviation comes to around 32.46.
- Standard Error = standard deviation / √n, where n is the samples considered which are four. ( The years mentioned )
- Degree of freedom is 3 (n-1) that is (4-1=3)
- So, on that basis, the T stats can be calculated as :- T = ( mean value calculated - mean value stated in hypothesis) / Standard error
- This corresponds to -0.007 and the p-value calculated is (0.49+0.50=0.99) considering level of significance as 0.05. This is stated as p < -0.007 (0.49) and p > 0.007 (0.50).
Add Answer to:
PLEASE HELPING ON EXERCISE 4! THANK YOU! RELATED PROBLEMS: Exercise 4: Annual Precipitation Repeat the procedures o...
Answer question 4-5. Thanks The Global Land and Ocean Temperature Anomalies (the difference between the actual...
 Answer question 4-5. Thanks
The Global Land and Ocean Temperature Anomalies (the difference between the actual temperature and the mean (normal) temperature were calculated every November from 1880-2015, and they are presented below in Table 2 . Create a graphical representation of the data with the Tomperatan Amaier on the y-axis and Yar on the 2. Find the average, standard deviation, and range of the temperature anomalies. Interpret the results. 3. Find the average temperature anomalies and standard deviations for...
Answer question 4-5. Thanks
The Global Land and Ocean Temperature Anomalies (the difference between the actual temperature and the mean (normal) temperature were calculated every November from 1880-2015, and they are presented below in Table 2 . Create a graphical representation of the data with the Tomperatan Amaier on the y-axis and Yar on the 2. Find the average, standard deviation, and range of the temperature anomalies. Interpret the results. 3. Find the average temperature anomalies and standard deviations for...
Answer each question please The Global Land and Ocean Temperature Anomalies (the difference between the actual...
 Answer each question please
The Global Land and Ocean Temperature Anomalies (the difference between the actual temperature and the mean (normal) temperature were calculated every November from 1880-2015, and they are presented below in Table 2 . Create a graphical representation of the data with the Tomperatan Amaier on the y-axis and Yar on the 2. Find the average, standard deviation, and range of the temperature anomalies. Interpret the results. 3. Find the average temperature anomalies and standard deviations for...
Answer each question please
The Global Land and Ocean Temperature Anomalies (the difference between the actual temperature and the mean (normal) temperature were calculated every November from 1880-2015, and they are presented below in Table 2 . Create a graphical representation of the data with the Tomperatan Amaier on the y-axis and Yar on the 2. Find the average, standard deviation, and range of the temperature anomalies. Interpret the results. 3. Find the average temperature anomalies and standard deviations for...
Problem: The average annual water level of Lake Michigan since 1860 has been provided in the...
Problem: The average annual water level of Lake Michigan since 1860 has been provided in the file “LMWL.txt”. The file is formatted so that the first column is the year and the second column is the average water level in feet above sea level for that year. Write a program to obtain the following information: What year had the lowest average water level, and what was the level (in feet)? What has the average water level of Lake Michigan been,...
 Answer question 4-5. Thanks
The Global Land and Ocean Temperature Anomalies (the difference between the actual temperature and the mean (normal) temperature were calculated every November from 1880-2015, and they are presented below in Table 2 . Create a graphical representation of the data with the Tomperatan Amaier on the y-axis and Yar on the 2. Find the average, standard deviation, and range of the temperature anomalies. Interpret the results. 3. Find the average temperature anomalies and standard deviations for...
Answer question 4-5. Thanks
The Global Land and Ocean Temperature Anomalies (the difference between the actual temperature and the mean (normal) temperature were calculated every November from 1880-2015, and they are presented below in Table 2 . Create a graphical representation of the data with the Tomperatan Amaier on the y-axis and Yar on the 2. Find the average, standard deviation, and range of the temperature anomalies. Interpret the results. 3. Find the average temperature anomalies and standard deviations for...
 Answer each question please
The Global Land and Ocean Temperature Anomalies (the difference between the actual temperature and the mean (normal) temperature were calculated every November from 1880-2015, and they are presented below in Table 2 . Create a graphical representation of the data with the Tomperatan Amaier on the y-axis and Yar on the 2. Find the average, standard deviation, and range of the temperature anomalies. Interpret the results. 3. Find the average temperature anomalies and standard deviations for...
Answer each question please
The Global Land and Ocean Temperature Anomalies (the difference between the actual temperature and the mean (normal) temperature were calculated every November from 1880-2015, and they are presented below in Table 2 . Create a graphical representation of the data with the Tomperatan Amaier on the y-axis and Yar on the 2. Find the average, standard deviation, and range of the temperature anomalies. Interpret the results. 3. Find the average temperature anomalies and standard deviations for...
Most questions answered within 3 hours.
-
A combustion reaction is describes as a carbon source reacting
with oxygen and producing carbon dioxide...
asked 2 minutes ago -
Buckminsterfullerence is a recently allotrope of carbon in which
carbon atoms form molecules of formula C_60,...
asked 4 minutes ago -
Lower Equitorial and Upper Equitorial are the same except Lower
Equitorial has a larger capital stock....
asked 9 minutes ago -
how do you think that pH of a jar where you have added a certain
amount...
asked 19 minutes ago -
If the Federal Reserve increases the reserve requirement, what
will happen to the Money Supply in...
asked 14 minutes ago -
Suppose that market demand for a good is given by Q = 9 - 0.3 P...
asked 20 minutes ago -
two thin lenses are separated by a distance x. The first lens
has a focal length...
asked 21 minutes ago -
The computer that controls a bank's automatic teller machine
crashes a mean of 0.6 times per...
asked 25 minutes ago -
`1) How is -9 (base 10) represented in 8-bit two's complement
notation?
a) 00001001
b)11110111
c)11110110...
asked 35 minutes ago -
A 10.000 g sample of water contains 11.19% H by mass. what
should be the %H...
asked 52 minutes ago -
Consider an investment game among 2 players. Each player can
either invest,
i, or not invest,-i....
asked 50 minutes ago -
The time taken to complete a particular task is normally
distributed with a standard deviation of...
asked 1 hour ago