
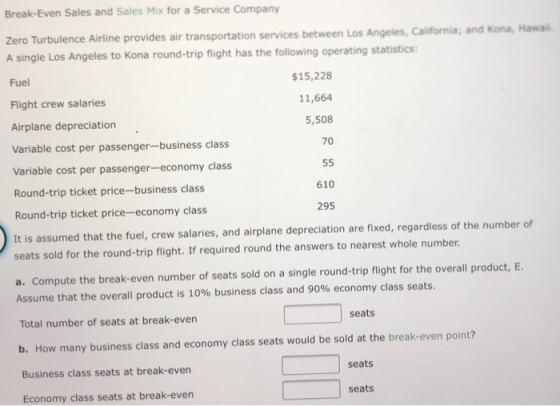
Break-Even Sales and Sales Mix for a Service Company Zero Turbulence Airline provides air transportation services between Los Angeles, California; and Kona, Hawail. A single Los Angeles to Kona round-trip flight has the following operating statistics Fuel $15,228 Flight crew salaries 11,664 Airplane depreciation 5,508 Variable cost per passenger-business class 70 Variable cost per passenger-economy class 610 Round-trip ticket price-business class Round-trip ticket price-economy class 295 It is assumed that the fuel, crew salaries, and airplane depreciation are fixed, regardless of the number of seats sold for the round-trip flight. If required round the answers to nearest whole number. a. Compute the break-even number of seats sold on a single round-trip flight for the overall product, E. Assume that the overall product is 10% business class and 90% economy class seats. seats Total number of seats at break-even b. How many business class and economy class seats would be sold at the break-even point? seats Business class seats at break-even seats Economy class seats at break-even
Homework Answers
a.
Total direct materials cost = Cost Graph Four
This graph depicts a linear relationship, that is, the
proportionate increase in units is equal to the proportionate
increase in the costs. This is the nature of direct material cost,
it increase with the increase in output
b.
Cost graph Two depicts this cost.
If you see clearly, this cost graph does not start at ZERO. It
starts at a fixed base amount which is $1,000. And then increase
with the increase in units forming a linear relationship from
there
c.
Cost Graph Three depicts this.
Depreciation in totality remains the same. But if the units are
increased the per unit depreciation will decrease since the
denominator is increasing. The graph depicts the same.
d.
Cost Graph one depicts fixed costs. If you see the costs remain the
same, there are no increased, there are no decreases. Supervisor's
salary is one such cost. There are no increases, no decreases with
the output.
We need to calculate weighted average break even first.
Contribution per business class seat = Sale price per business
class seat - Variable cost per business Class seat = 610 - 70
= $540 per seat
Contribution per economy class seat = Sale price per economy
class seat - Variable cost per economy Class seat = 295 - 55
=
$240 per seat
Weighted average contribution = 540 X 10% + 240 X 90% = $270
Breakeven Sales = Fixed Costs / Contribution per seat
= (15,228 + 11,664 + 5,508) / 270
= 120 seats
Business (10%) = 12 seats
Economy (90%) = 108 seats
Add Answer to:
Identify Cost Graphs The following cost graphs illustrate various types of cost behv Cost Graph w Cost Graph One 0...
Zero Turbulence Airline provides air transportation services between Los Angeles, California; and Kona, Hawaii. A single...
Zero Turbulence Airline provides air transportation services between Los Angeles, California; and Kona, Hawaii. A single Los Angeles to Kona round-trip flight has the following operating statistics: Fuel $13,395 Flight crew salaries 10,260 Airplane depreciation 4,845 Variable cost per passenger—business class 60 Variable cost per passenger—economy class 50 Round-trip ticket price—business class 570 Round-trip ticket price—economy class 310 It is assumed that the fuel, crew salaries, and airplane depreciation are fixed, regardless of the number of seats sold for the...
Zero Turbulence Airline provides air transportation services between Los Angeles, California; and Kona, Hawaii. A single...
Zero Turbulence Airline provides air transportation services between Los Angeles, California; and Kona, Hawaii. A single Los Angeles to Kona round-trip flight has the following operating statistics: Fuel $10,702 Flight crew salaries 8,197 Airplane depreciation 3,871 Variable cost per passenger—business class 55 Variable cost per passenger—economy class 45 Round-trip ticket price—business class 515 Round-trip ticket price—economy class 275 It is assumed that the fuel, crew salaries, and airplane depreciation are fixed, regardless of the number of seats sold for the...
Zero Turbulence Airline provides air transportation services between Los Angeles, California, and Kona, Hawaii. A single...
Zero Turbulence Airline provides air transportation services between Los Angeles, California, and Kona, Hawaii. A single Los Angeles to Kona round-trip flight has the following operating statistics: Fuel $7,000 Flight crew salaries 3,200 Airplane depreciation 3,480 Variable cost per passenger—business class 140 Variable cost per passenger—economy class 120 Round-trip ticket price—business class 800 Round-trip ticket price—economy class 300 It is assumed that the fuel, crew salaries, and airplane depreciation are fixed, regardless of the number of seats sold for the...
Break-Even Sales and Sales Mix for a Service Company Zero Turbulence Airline provides air transportation services...
Break-Even Sales and Sales Mix for a Service Company Zero Turbulence Airline provides air transportation services between Los Angeles, California; and Kona, Hawaii. A single Los Angeles to Kona round-trip flight has the following operating statistics: Fuel $11,506 Flight crew salaries 8,813 Airplane depreciation 4,161 Variable cost per passenger—business class 45 Variable cost per passenger—economy class 35 Round-trip ticket price—business class 515 Round-trip ticket price—economy class 285 It is assumed that the fuel, crew salaries, and airplane depreciation are fixed,...
Break-Even Sales and Sales Mix for a Service Company Zero Turbulence Airline provides air transportation services...
 Break-Even Sales and Sales Mix for a Service Company Zero Turbulence Airline provides air transportation services between Los Angeles, California; and Kona, Hawaii. A single Los Angeles to Kona round-trip flight has following operating statistics: Fuel Flight crew salaries $13,804 10,573 4,993 Airplane depreciation Variable cost per passenger-business class Variable cost per passenger-economy class 30 Round-trip ticket price-business class Round-trip ticket price-economy class 550 270 It is assumed that the fuel, crew salaries, and airplane depreciation are fixed, regardless of...
Break-Even Sales and Sales Mix for a Service Company Zero Turbulence Airline provides air transportation services...
 Break-Even Sales and Sales Mix for a Service Company Zero Turbulence Airline provides air transportation services between Los Angeles, California; and Kona, Hawaii. A single Los Angeles to Kona round-trip flight has the following operating statistics: Fuel $11,506 Flight crew salaries Airplane depreciation Variable cost per passenger-business class 8,813 4,161 Variable cost per passenger-economy class 50 Round-trip ticket price-business class Round-trip ticket price-economy class 310 It is assumed that the fuel, crew salaries, and airplane depreciation are fixed, regardless of...
Break-Even Sales and Sales Mix for a Service Company Zero Turbulence Airline provides air transportation services betwe...
 Break-Even Sales and Sales Mix for a Service Company Zero Turbulence Airline provides air transportation services between Los Angeles, California; and Kona, Hawaii. A single Los Angeles to Kona round-trip flight has the following operating statistics: Fuel $9,325 Flight crew salaries 7,142 Airplane depreciation 3,373 Variable cost per passenger-business class слол Variable cost per passenger-economy class 45 Round-trip ticket price-business class 555 Round-trip ticket price-economy class 265 It is assumed that the fuel, crew salaries, and airplane depreciation are fixed,...
Break-Even Sales and Sales Mix for a Service Company Zero Turbulence Airline provides air transportation services...
Break-Even Sales and Sales Mix for a Service Company Zero Turbulence Airline provides air transportation services between Los Angeles, California; and Kona, Hawaii. A single Los Angeles to Kona round-trip flight has the following operating statistics: Fuel $6,956 Flight crew salaries 5,328 Airplane depreciation 2,516 Variable cost per passenger—business class 45 Variable cost per passenger—economy class 35 Round-trip ticket price—business class 525 Round-trip ticket price—economy class 285 It is assumed that the fuel, crew salaries, and airplane depreciation are fixed,...
Break-Even Sales and Sales Mix for a Service Company Zero Turbulence Airline provides air transportation services...
 Break-Even Sales and Sales Mix for a Service Company Zero Turbulence Airline provides air transportation services between Los Angeles, California; and Kona, Hawail. A single Los Angeles to Kona round-trip flight has the following operating statistics: Fuel Flight crew salaries Airplane depreciation Variable cost per passenger-business class Variable cost per passenger-economy dass Round-trip ticket price-business class Round-trip ticket price-economy dlass It is assumed that the fuel, crew salaries, and airplane depreciation are fixed, $10,594 8,114 3,832 70 600 325 regardless...
21-3 Exercises & Problems Break-Even Sales and Sales Mix for a Service Company Zero Turbulence Airline provides air...
 21-3 Exercises & Problems Break-Even Sales and Sales Mix for a Service Company Zero Turbulence Airline provides air transportation services between Los Angeles, California; and Kona, Hawaii. A single Los Angeles to Kona round-trip flight has the following operating statistics: Fuel $5,828 4,464 2,108 Flight crew salaries Airplane depreciation Variable cost per passenger-business class Variable cost per passenger-economy class Round-trip ticket price-business class Round-trip ticket price-economy class 40 30 540 250 It is assumed that the fuel, crew salaries, and...
 Break-Even Sales and Sales Mix for a Service Company Zero Turbulence Airline provides air transportation services between Los Angeles, California; and Kona, Hawaii. A single Los Angeles to Kona round-trip flight has following operating statistics: Fuel Flight crew salaries $13,804 10,573 4,993 Airplane depreciation Variable cost per passenger-business class Variable cost per passenger-economy class 30 Round-trip ticket price-business class Round-trip ticket price-economy class 550 270 It is assumed that the fuel, crew salaries, and airplane depreciation are fixed, regardless of...
 Break-Even Sales and Sales Mix for a Service Company Zero Turbulence Airline provides air transportation services between Los Angeles, California; and Kona, Hawaii. A single Los Angeles to Kona round-trip flight has the following operating statistics: Fuel $11,506 Flight crew salaries Airplane depreciation Variable cost per passenger-business class 8,813 4,161 Variable cost per passenger-economy class 50 Round-trip ticket price-business class Round-trip ticket price-economy class 310 It is assumed that the fuel, crew salaries, and airplane depreciation are fixed, regardless of...
 Break-Even Sales and Sales Mix for a Service Company Zero Turbulence Airline provides air transportation services between Los Angeles, California; and Kona, Hawaii. A single Los Angeles to Kona round-trip flight has the following operating statistics: Fuel $9,325 Flight crew salaries 7,142 Airplane depreciation 3,373 Variable cost per passenger-business class слол Variable cost per passenger-economy class 45 Round-trip ticket price-business class 555 Round-trip ticket price-economy class 265 It is assumed that the fuel, crew salaries, and airplane depreciation are fixed,...
 Break-Even Sales and Sales Mix for a Service Company Zero Turbulence Airline provides air transportation services between Los Angeles, California; and Kona, Hawail. A single Los Angeles to Kona round-trip flight has the following operating statistics: Fuel Flight crew salaries Airplane depreciation Variable cost per passenger-business class Variable cost per passenger-economy dass Round-trip ticket price-business class Round-trip ticket price-economy dlass It is assumed that the fuel, crew salaries, and airplane depreciation are fixed, $10,594 8,114 3,832 70 600 325 regardless...
 21-3 Exercises & Problems Break-Even Sales and Sales Mix for a Service Company Zero Turbulence Airline provides air transportation services between Los Angeles, California; and Kona, Hawaii. A single Los Angeles to Kona round-trip flight has the following operating statistics: Fuel $5,828 4,464 2,108 Flight crew salaries Airplane depreciation Variable cost per passenger-business class Variable cost per passenger-economy class Round-trip ticket price-business class Round-trip ticket price-economy class 40 30 540 250 It is assumed that the fuel, crew salaries, and...
Most questions answered within 3 hours.
-
While rotating the tires on your car you notice a rock [mass =
0.1 Kg] stuck...
asked 42 minutes ago -
Using MARS simulator, write MIPS programs according to
the following scenarios: Receive a positive integer number...
asked 2 hours ago -
An object in front of a concave mirror has a real image that is
11.5 cm...
asked 2 hours ago -
Consider the reaction, C3 H8 + O2 --> CO2 + H2O. How many
moles of O2...
asked 4 hours ago -
You and your opponent both roll a fair die. If you both roll the
same number,...
asked 4 hours ago -
In a study of the accuracy of fast food drive-through orders,
Restaurant A had 257 accurate...
asked 4 hours ago -
Identify and describe in detail the four categories of
institutions that could be included in a...
asked 4 hours ago -
In python
class Customer:
def __init__(self, customer_id, last_name, first_name, phone_number, address):
self._customer_id = int(customer_id)
self._last_name =...
asked 5 hours ago -
What is an example of a limitation in implementing a new
ERP system and how it...
asked 4 hours ago -
In a section of 9.7cm of an artery with a radius of 2.6mm there
is a...
asked 4 hours ago -
the two carboxylic acid groups of aspartic acid have different
acidities with pKa values of 2.1...
asked 5 hours ago -
Would CuCO3 aqueous salt combined with calcium chloride
form a solid precipitate? If so, what would...
asked 5 hours ago