
Homework Answers
Hope it helps you out.
In case any doubt please feel free to ask.
I will be happy to help you.
Thanks! !
Add Answer to:
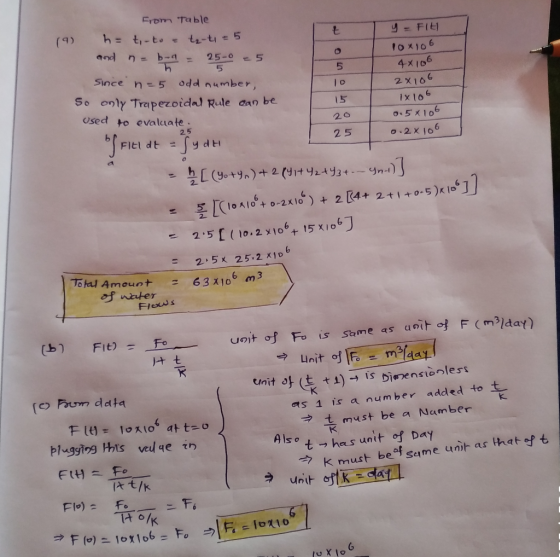
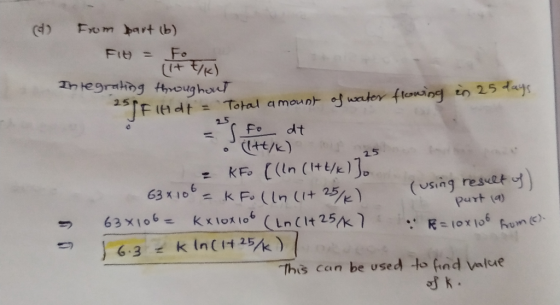
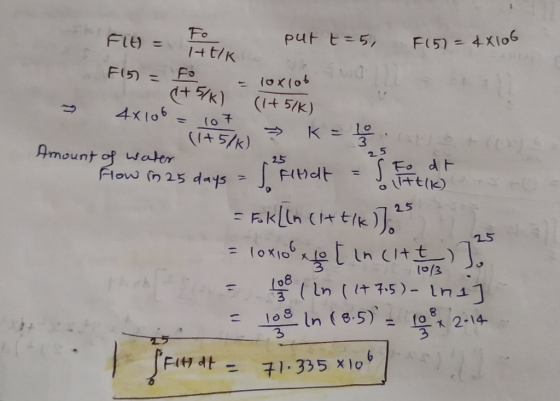
The flow, F, in a river was measured as a function of time, t, and the following data were obtained. F (m/day) t (d...
Problem 4: (Numerical Integration) Given: u(x)-f (x)+K(x.t) u(t) dr Where a and b and the function f and K are given. To approximate the function u on the interval [a, b]. a partition j a < xi <...
 Problem 4: (Numerical Integration) Given: u(x)-f (x)+K(x.t) u(t) dr Where a and b and the function f and K are given. To approximate the function u on the interval [a, b]. a partition j a < xi < < x-1 < x-= b is selected and the equation: u(x)- f(xK(x,t) u(t) dt. for eaci 0-.m Are solved for u(xo).ux)u(). The integrals are approximated using quadrature formulas based on the nodes tgIn this problem, a-0, b1, f (x)-, and In this...
for part A which answer is correct? The given function is... cos(t) f(t) t We know...
 for
part A which answer is correct?
The given function is... cos(t) f(t) t We know that the laplace transform of f(t) is given by... Rel(s)> 0 s21 LIf()) Also we know that... f(t) L[ t Lf(lds ds s21 = [In(s2 1) Problem is done cos(t) x(t) t tx(t) cos(t)ut) dX(s) tx(t) ds s2 ds X(s) s2 In(s21) K X(s) = 2 x(t)e dt X(s) -00 X(0) x(t)dt -00 cos(t) dt 0 t -00 K 0 In(s21 X(s) 2 Use...
for
part A which answer is correct?
The given function is... cos(t) f(t) t We know that the laplace transform of f(t) is given by... Rel(s)> 0 s21 LIf()) Also we know that... f(t) L[ t Lf(lds ds s21 = [In(s2 1) Problem is done cos(t) x(t) t tx(t) cos(t)ut) dX(s) tx(t) ds s2 ds X(s) s2 In(s21) K X(s) = 2 x(t)e dt X(s) -00 X(0) x(t)dt -00 cos(t) dt 0 t -00 K 0 In(s21 X(s) 2 Use...
2. Consider the following 1-D wave equation with initial condition u (x, 0)- F (x) where F(x) is a given function. a) Show that u (x, t)-F (x - t) is a solution to the given PDE. b) If the function F...
 2. Consider the following 1-D wave equation with initial condition u (x, 0)- F (x) where F(x) is a given function. a) Show that u (x, t)-F (x - t) is a solution to the given PDE. b) If the function F is given as 1; x< 10 x > 10 u(x, 0) = F(x) = use part (a) to write the solution u(x, t) c) Sketch u(x,0) and u(x,1) on the same u-versus-x graph d) Explain in your own...
1. (2 pts each) The graph of some unknown function f is given below. 10 6/ 8-64-2 624 10 12 Use the graph to estimate the following quantities: (0 f (9) (g) f(4) b) lim (a) lim (e) (d) lim ( 6)...
 1. (2 pts each) The graph of some unknown function f is given below. 10 6/ 8-64-2 624 10 12 Use the graph to estimate the following quantities: (0 f (9) (g) f(4) b) lim (a) lim (e) (d) lim ( 6) (e) lim f(x) (c) lim f(x) if g(x)f(x) 6) a value of r where f is continuous but not differentiable (k) a value of r where f"(x) 0 and f"(x)>0 (1) the location of a relative maximum value...
6. For f(x) = 2 + tan for-360° SXS 360°. (a) For what values are there...
 6. For f(x) = 2 + tan for-360° SXS 360°. (a) For what values are there asymptotes? (b) Write down (i) the period of the function; (ii) the value off (90°). (e) Solve f (x) = 0 for -360° SXS 360°. 4. Let (c) - cos (2x + 2), 0 S IS A. Sketch the curve of y=f(x) on the grid below. os | 15 1 25 35 The following graph shows the depth of water, y metres, at a...
5. Parameter Estimation. Given a time-dependent model with parameter vector f(t;p) and data r = =...
 5. Parameter Estimation. Given a time-dependent model with parameter vector f(t;p) and data r = = [1,2,...) a times tu, ta, ...tn (a) [10 pts) write down the squared-error function, E(p). (b) (10 pts) Write down in general and describe in words the hill-climbing algorithm equation. (c) (20 pts) Letting ft;p) = P(3)? +p(2)t + P(1), write down the specific hill-climbing algorithm equation.
(a) Use the following data to find the velocity and acceleration at t = 10 seconds:
Numerical methods(a) Use the following data to find the velocity and acceleration at t = 10 seconds:Time (s):0246810121416Position (m):00.71.83.45.16.37.38.08.4Use second-order correct (i) centered finite-difference, and (ii) backward finite-difference methods. (b) Use the Taylor expansions for f(x +h), f(x+2h), f(x +3h) and derive the following forward finite-difference formulas for the second derivative. Write down the error term$$ f^{\prime \prime}(x) \approx \frac{-f(x+3 h)+4 f(x+2 h)-5 f(x+h)+2 f(x)}{h^{2}} $$
(1 point) A stone is thrown from a rooftop at time t 0 seconds. Its position at time t (the components are measured in meters) is given by r()-бі-50+ (24.5-49:2) k. The origin is at the base of...
 (1 point) A stone is thrown from a rooftop at time t 0 seconds. Its position at time t (the components are measured in meters) is given by r()-бі-50+ (24.5-49:2) k. The origin is at the base of the bulding, which is standing on flat ground. Distance is measured in meters. The vector i points east,j points north, and k points up. (a) How high is the rooftop? meters. (b) When does the stone hit the ground? seconds (c) Where...
please answer each part with steps included! 3. (10 points) Consider the function f(t) = 32...
 please answer each part with steps included!
3. (10 points) Consider the function f(t) = 32 - 10, and notice that its positive zero is == V10. In this problem, you will use Calculus to estimate 10 to several decimal places. (A) (2 points) Since 3=V9 is close to V10, it is a good place to start. Write down the tangent line to y=f(x) at a = 3. (b) (2 points) Now find the intercept of the tangent line to...
please answer each part with steps included!
3. (10 points) Consider the function f(t) = 32 - 10, and notice that its positive zero is == V10. In this problem, you will use Calculus to estimate 10 to several decimal places. (A) (2 points) Since 3=V9 is close to V10, it is a good place to start. Write down the tangent line to y=f(x) at a = 3. (b) (2 points) Now find the intercept of the tangent line to...
The population of fish, P, in a lake is a function of time, t, measured in years. The rate of cha...
 The population of fish, P, in a lake is a function of time, t, measured in years. The rate of change of P is given by 7600e0.4t fish/year. dt(19 + e0.4t)2 dp dt a. Graph on the domain [0, 20]. Make sure your graph is properly labeled. b. Estimate the change in population on the time interval 0 s t š 20 years. Use 10 intervals, each lasting two years. Use rate of change data from the left side of...
 Problem 4: (Numerical Integration) Given: u(x)-f (x)+K(x.t) u(t) dr Where a and b and the function f and K are given. To approximate the function u on the interval [a, b]. a partition j a < xi < < x-1 < x-= b is selected and the equation: u(x)- f(xK(x,t) u(t) dt. for eaci 0-.m Are solved for u(xo).ux)u(). The integrals are approximated using quadrature formulas based on the nodes tgIn this problem, a-0, b1, f (x)-, and In this...
 for
part A which answer is correct?
The given function is... cos(t) f(t) t We know that the laplace transform of f(t) is given by... Rel(s)> 0 s21 LIf()) Also we know that... f(t) L[ t Lf(lds ds s21 = [In(s2 1) Problem is done cos(t) x(t) t tx(t) cos(t)ut) dX(s) tx(t) ds s2 ds X(s) s2 In(s21) K X(s) = 2 x(t)e dt X(s) -00 X(0) x(t)dt -00 cos(t) dt 0 t -00 K 0 In(s21 X(s) 2 Use...
for
part A which answer is correct?
The given function is... cos(t) f(t) t We know that the laplace transform of f(t) is given by... Rel(s)> 0 s21 LIf()) Also we know that... f(t) L[ t Lf(lds ds s21 = [In(s2 1) Problem is done cos(t) x(t) t tx(t) cos(t)ut) dX(s) tx(t) ds s2 ds X(s) s2 In(s21) K X(s) = 2 x(t)e dt X(s) -00 X(0) x(t)dt -00 cos(t) dt 0 t -00 K 0 In(s21 X(s) 2 Use...
 2. Consider the following 1-D wave equation with initial condition u (x, 0)- F (x) where F(x) is a given function. a) Show that u (x, t)-F (x - t) is a solution to the given PDE. b) If the function F is given as 1; x< 10 x > 10 u(x, 0) = F(x) = use part (a) to write the solution u(x, t) c) Sketch u(x,0) and u(x,1) on the same u-versus-x graph d) Explain in your own...
 1. (2 pts each) The graph of some unknown function f is given below. 10 6/ 8-64-2 624 10 12 Use the graph to estimate the following quantities: (0 f (9) (g) f(4) b) lim (a) lim (e) (d) lim ( 6) (e) lim f(x) (c) lim f(x) if g(x)f(x) 6) a value of r where f is continuous but not differentiable (k) a value of r where f"(x) 0 and f"(x)>0 (1) the location of a relative maximum value...
 6. For f(x) = 2 + tan for-360° SXS 360°. (a) For what values are there asymptotes? (b) Write down (i) the period of the function; (ii) the value off (90°). (e) Solve f (x) = 0 for -360° SXS 360°. 4. Let (c) - cos (2x + 2), 0 S IS A. Sketch the curve of y=f(x) on the grid below. os | 15 1 25 35 The following graph shows the depth of water, y metres, at a...
 5. Parameter Estimation. Given a time-dependent model with parameter vector f(t;p) and data r = = [1,2,...) a times tu, ta, ...tn (a) [10 pts) write down the squared-error function, E(p). (b) (10 pts) Write down in general and describe in words the hill-climbing algorithm equation. (c) (20 pts) Letting ft;p) = P(3)? +p(2)t + P(1), write down the specific hill-climbing algorithm equation.
 (1 point) A stone is thrown from a rooftop at time t 0 seconds. Its position at time t (the components are measured in meters) is given by r()-бі-50+ (24.5-49:2) k. The origin is at the base of the bulding, which is standing on flat ground. Distance is measured in meters. The vector i points east,j points north, and k points up. (a) How high is the rooftop? meters. (b) When does the stone hit the ground? seconds (c) Where...
 please answer each part with steps included!
3. (10 points) Consider the function f(t) = 32 - 10, and notice that its positive zero is == V10. In this problem, you will use Calculus to estimate 10 to several decimal places. (A) (2 points) Since 3=V9 is close to V10, it is a good place to start. Write down the tangent line to y=f(x) at a = 3. (b) (2 points) Now find the intercept of the tangent line to...
please answer each part with steps included!
3. (10 points) Consider the function f(t) = 32 - 10, and notice that its positive zero is == V10. In this problem, you will use Calculus to estimate 10 to several decimal places. (A) (2 points) Since 3=V9 is close to V10, it is a good place to start. Write down the tangent line to y=f(x) at a = 3. (b) (2 points) Now find the intercept of the tangent line to...
 The population of fish, P, in a lake is a function of time, t, measured in years. The rate of change of P is given by 7600e0.4t fish/year. dt(19 + e0.4t)2 dp dt a. Graph on the domain [0, 20]. Make sure your graph is properly labeled. b. Estimate the change in population on the time interval 0 s t š 20 years. Use 10 intervals, each lasting two years. Use rate of change data from the left side of...
Most questions answered within 3 hours.
-
----Can someone please help me solve this one using JAVA
----I thank you in advance
Create...
asked 29 seconds from now -
1. What force primarily attracts the potassium ion to
the nitrate ion?
a. London forces...
asked 1 minute ago -
What are the negative effects of abruptly stopping the use of
all fossil fuels? Give at...
asked 7 minutes ago -
Given that many conflict are the result of different parties having
different interests, is it possible...
asked 12 minutes ago -
A 750 g block can slide uniformly along the horizontal track
when a string attached to...
asked 15 minutes ago -
In 2017, Juan entered into a contract to write a book. The
publisher advanced Juan $50,000,...
asked 29 minutes ago -
Determine the number of kinds of protons in each molecule (w/
respect to NMR spectroscopy). Drawing...
asked 39 minutes ago -
A jeweler whose near point is 68 cm from his eye uses a
magnifying glass as...
asked 37 minutes ago -
A company wants to determine how many units of each of two
products, A and B,...
asked 41 minutes ago -
The blood pressure of a person changes throughout the day.
Suppose the systolic blood pressure of...
asked 50 minutes ago -
A chemistry student desired to study sulfur. Sulfur exhibited
the following characteristics with oxygen:
(a) It...
asked 46 minutes ago -
An Atwood machine is constructed of a solid-disk frictionless
pulley of mass m3 and radius R....
asked 47 minutes ago