


Using samples of 198 credit card statements, an auditor found the following: Use Table-A Banple Number with errora 1 4 4 7 a. Determine the fraction defective in each sample. (Round your answers to 4 decimal places.) Sample Fraction defective 00251 2 002021 00354 b.lf the true fraction defective for this process is unknown, what is your estimate of it? (Round your answer to1 decimal place. Omit the "% " sign in your response.) Estimate 30 % c. What is your estimate of the mean and standard deviation of the sampling distribution of fractions defective for samples of this size? (Round your intermediate calculations and final answers to 4 decimal places) Mean 00122 Standard deiation d.What control limits would give an alpha risk of 03 for this process? (Round your intermediate calculations to 4 decimal places Round your "" value to 2 decimal places and other answers to 4 decimal places.) z 2 :00 to6056 e.What alpha risk would control limits of 0470 and 0136 provide? (Round your intermediate calculations to 4 decimal places. Round your "z" value to 2 decimal places and "alpha risk" value to 4 decimal places.) z- 7. alpha risk Prev 1 of 1 Next MacBook Pro % 2 3 4 5 P E R K S G N C V F
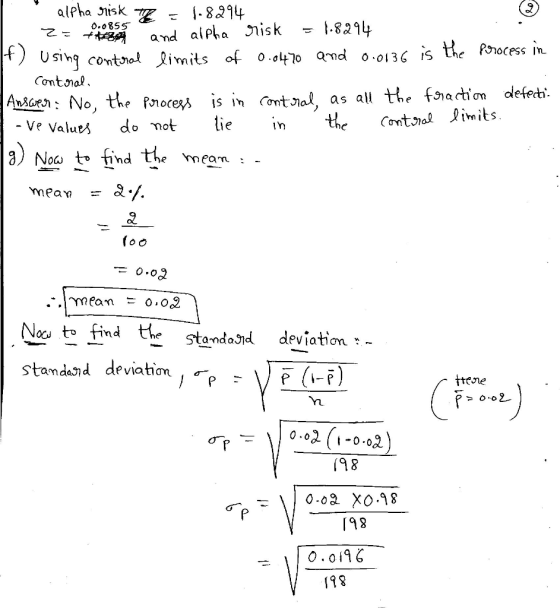
Mean Standard deviation d.What control limits would give an alpha risk of 03 for this process? (Round your intermediate calculations to 4 decimal places. Round your "2" value to 2 decimal places and other answers to 4 decimal places.) z 2) o007 toco e.What alpha risk would control limits of 0470 and .0136 provide? (Round your intermediate calculations to 4 decimal places. Round your "" value to 2 decimal places and "alpha risk" value to 4 decimal places.) 1. alpha risk z tUsing control imits of .0470 and 0136, is the process in control? ves Ono g.Suppose that the long-term fraction defective of the process is known to be 2 percent. What are the values of the mean and standard deviation of the sampling distribution? (Round your intermediate calculations and final answers to 2 decimal places) Nean Standard deviation h.Construct a control chart for the process, assuming a fraction defective of 2 percent, using two-sigma control limits. Is the process in control? O Yes O No 1 of 1 Prev Next X MacBook PrO 20 6 4 2 3 T R W E > V X Z option command command
Homework Answers


Add Answer to:
need help with E-H please Areas under the normal curve, O to z Table A 07 05 08 03 FA ES % & 2 コ 3a2コ 00 3a8...
Table A Areas under the normal curve, 0 to z 03 Z 00 0080 0120 01 0478 0517 15 16 19 o00 DI 02 E# e.What a...
 Table A Areas under the normal curve, 0 to z 03 Z 00 0080 0120 01 0478 0517 15 16 19 o00 DI 02 E# e.What alpha risk would control limits of .0470 and .0136 provide? (Round your intermediate calculations to 4 decimal places. Round your "z" value to 2 decimal places and "alpha risk" value to 4 decimal places.) 1, alpha risk z= fUsing control limits of .0470 and .0136, is the process in control? ook Oyes rint Ono...
I need answers to E - H please. Table A Areas under the normal curve, 0 to z 01 Z 00 15 19 Use Table-A 3 4 2 Sample...
 I need answers to E - H please.
Table A Areas under the normal curve, 0 to z 01 Z 00 15 19 Use Table-A 3 4 2 Sample Number with errors 7 5 4 a. Determine the fraction defective in each sample. (Round your answers to 4 decimal p Fraction defectve Sample 0.0253 1 0.0202 2 0.0354 3 0.0404 4 b.lf the true fraction defective for this process is unknown, what is your estimate of it? (Ro the "%"...
I need answers to E - H please.
Table A Areas under the normal curve, 0 to z 01 Z 00 15 19 Use Table-A 3 4 2 Sample Number with errors 7 5 4 a. Determine the fraction defective in each sample. (Round your answers to 4 decimal p Fraction defectve Sample 0.0253 1 0.0202 2 0.0354 3 0.0404 4 b.lf the true fraction defective for this process is unknown, what is your estimate of it? (Ro the "%"...
Using samples of 200 credit card statements, an auditor found the following: Use Table-A. Sample Number...
 Using samples of 200 credit card statements, an auditor found the following: Use Table-A. Sample Number with errors 1 4 2 1 3 6 4 12 a. Determine the fraction defective in each sample. (Round your answers to 4 decimal places.) Sample Fraction defective b. If the true fraction defective for this process is unknown, what is your estimate of it? (Enter your answer as a percentage rounded to 1 decimal place. Omit the "%" sign in your response.) Estimate...
Problem 4. Using samples of 200 credit card statements, an auditor found the following: Number with...
 Problem 4. Using samples of 200 credit card statements, an auditor found the following: Number with errors 4 25 9 a. Determine the fraction defective in each sample. b. If the true fraction defective for this process is unknown, what is your estimate of it? e. What is your estimate of the mean and standard deviation of the sampling distribution of fractions defective for samples of this size? d. What control limits would give an alpha risk of 03 for...
e: DO points oblem 10-2 n automatic filling machine is used to fill 1-liter bottles of...
 e: DO points oblem 10-2 n automatic filling machine is used to fill 1-liter bottles of cola. The machine's output is approximately ormal with a mean of 1.00 liter and a standard deviation of 0.05 liter. Output is monitored using means of amples of 29 observations. Use Table-A a. Determine upper and lower control limits that will include roughly 97 percent of the sample means when the process is in control. (Do not round intermediate calculations. Round z value to...
Need help with b1 and b2 please explain with details.Thx Consider the following table for a...
 Need help with b1 and b2 please explain with details.Thx
Consider the following table for a period of six years: Returns Large- Company Stocks U.S Treasury Bills Year 1 -15.29% 7.41% 2 -26.65 8.05 3 37.35 24.05 5.99 4 5.67 5 7.40 5.51 6 6.69 7.82 a-1. Calculate the arithmetic average returns for large-company stocks and T-bills over this time period. (Do not round intermediate calculations and enter your answers as a percent rounded to 2 decimal places, e.g., 32.16.)...
Need help with b1 and b2 please explain with details.Thx
Consider the following table for a period of six years: Returns Large- Company Stocks U.S Treasury Bills Year 1 -15.29% 7.41% 2 -26.65 8.05 3 37.35 24.05 5.99 4 5.67 5 7.40 5.51 6 6.69 7.82 a-1. Calculate the arithmetic average returns for large-company stocks and T-bills over this time period. (Do not round intermediate calculations and enter your answers as a percent rounded to 2 decimal places, e.g., 32.16.)...
An automatic filling machine is used to fill 1-liter bottles of cola. The machine’s output is...
An automatic filling machine is used to fill 1-liter bottles of cola. The machine’s output is approximately normal with a mean of 0.99 liter and a standard deviation of 0.04 liter. Output is monitored using means of samples of 26 observations. Use Table-A. a.Determine upper and lower control limits that will include roughly 97 percent of the sample means when the process is in control. (Do not round intermediate calculations. Round z value to 2 decimal places. Round your answers...
An automatic filling machine is used to fill 1-liter bottles of cola. The machine's output is...
 An automatic filling machine is used to fill 1-liter bottles of cola. The machine's output is approximately normal with a mean of O.99 liter and a standard deviation of 0.04 liter. Output is monitored using means of samples of 26 observations. Use Table-A a.Determine upper and lower control limits that will include roughly 97 percent of the sample means when the process is in control. (Do not round intermediate calculations. Round z value to 2 decimal places. Round your answers...
1) Find the area under the standard normal curve to the right of z= -0.62. Round...
1) Find the area under the standard normal curve to the right of z= -0.62. Round your answer to four decimal places. 2) Find the following probability for the standard normal distribution. Round your answer to four decimal places. P( z < - 1.85) = 3) Obtain the following probability for the standard normal distribution. P(z<-5.43)= 4) Use a table, calculator, or computer to find the specified area under a standard normal curve. Round your answers to 4 decimal places....
PLEASE HELP Use the following to answer questions 20-25: A company makes plastic cups. Four samples...
 PLEASE HELP
Use the following to answer questions 20-25: A company makes plastic cups. Four samples of 15 cups were taken from an ongoing process to establish ap chart for control. The samples and the number of defectives in each are shown in the following table: Sample n Number of Defectives 1 15 2 2 15 o 3 15 3 15 5 Question 22 1 pts What is the standard deviation of the sampling distribution of sample proportion defective? Please...
PLEASE HELP
Use the following to answer questions 20-25: A company makes plastic cups. Four samples of 15 cups were taken from an ongoing process to establish ap chart for control. The samples and the number of defectives in each are shown in the following table: Sample n Number of Defectives 1 15 2 2 15 o 3 15 3 15 5 Question 22 1 pts What is the standard deviation of the sampling distribution of sample proportion defective? Please...
 Table A Areas under the normal curve, 0 to z 03 Z 00 0080 0120 01 0478 0517 15 16 19 o00 DI 02 E# e.What alpha risk would control limits of .0470 and .0136 provide? (Round your intermediate calculations to 4 decimal places. Round your "z" value to 2 decimal places and "alpha risk" value to 4 decimal places.) 1, alpha risk z= fUsing control limits of .0470 and .0136, is the process in control? ook Oyes rint Ono...
 I need answers to E - H please.
Table A Areas under the normal curve, 0 to z 01 Z 00 15 19 Use Table-A 3 4 2 Sample Number with errors 7 5 4 a. Determine the fraction defective in each sample. (Round your answers to 4 decimal p Fraction defectve Sample 0.0253 1 0.0202 2 0.0354 3 0.0404 4 b.lf the true fraction defective for this process is unknown, what is your estimate of it? (Ro the "%"...
I need answers to E - H please.
Table A Areas under the normal curve, 0 to z 01 Z 00 15 19 Use Table-A 3 4 2 Sample Number with errors 7 5 4 a. Determine the fraction defective in each sample. (Round your answers to 4 decimal p Fraction defectve Sample 0.0253 1 0.0202 2 0.0354 3 0.0404 4 b.lf the true fraction defective for this process is unknown, what is your estimate of it? (Ro the "%"...
 Using samples of 200 credit card statements, an auditor found the following: Use Table-A. Sample Number with errors 1 4 2 1 3 6 4 12 a. Determine the fraction defective in each sample. (Round your answers to 4 decimal places.) Sample Fraction defective b. If the true fraction defective for this process is unknown, what is your estimate of it? (Enter your answer as a percentage rounded to 1 decimal place. Omit the "%" sign in your response.) Estimate...
 Problem 4. Using samples of 200 credit card statements, an auditor found the following: Number with errors 4 25 9 a. Determine the fraction defective in each sample. b. If the true fraction defective for this process is unknown, what is your estimate of it? e. What is your estimate of the mean and standard deviation of the sampling distribution of fractions defective for samples of this size? d. What control limits would give an alpha risk of 03 for...
 e: DO points oblem 10-2 n automatic filling machine is used to fill 1-liter bottles of cola. The machine's output is approximately ormal with a mean of 1.00 liter and a standard deviation of 0.05 liter. Output is monitored using means of amples of 29 observations. Use Table-A a. Determine upper and lower control limits that will include roughly 97 percent of the sample means when the process is in control. (Do not round intermediate calculations. Round z value to...
 Need help with b1 and b2 please explain with details.Thx
Consider the following table for a period of six years: Returns Large- Company Stocks U.S Treasury Bills Year 1 -15.29% 7.41% 2 -26.65 8.05 3 37.35 24.05 5.99 4 5.67 5 7.40 5.51 6 6.69 7.82 a-1. Calculate the arithmetic average returns for large-company stocks and T-bills over this time period. (Do not round intermediate calculations and enter your answers as a percent rounded to 2 decimal places, e.g., 32.16.)...
Need help with b1 and b2 please explain with details.Thx
Consider the following table for a period of six years: Returns Large- Company Stocks U.S Treasury Bills Year 1 -15.29% 7.41% 2 -26.65 8.05 3 37.35 24.05 5.99 4 5.67 5 7.40 5.51 6 6.69 7.82 a-1. Calculate the arithmetic average returns for large-company stocks and T-bills over this time period. (Do not round intermediate calculations and enter your answers as a percent rounded to 2 decimal places, e.g., 32.16.)...
 An automatic filling machine is used to fill 1-liter bottles of cola. The machine's output is approximately normal with a mean of O.99 liter and a standard deviation of 0.04 liter. Output is monitored using means of samples of 26 observations. Use Table-A a.Determine upper and lower control limits that will include roughly 97 percent of the sample means when the process is in control. (Do not round intermediate calculations. Round z value to 2 decimal places. Round your answers...
 PLEASE HELP
Use the following to answer questions 20-25: A company makes plastic cups. Four samples of 15 cups were taken from an ongoing process to establish ap chart for control. The samples and the number of defectives in each are shown in the following table: Sample n Number of Defectives 1 15 2 2 15 o 3 15 3 15 5 Question 22 1 pts What is the standard deviation of the sampling distribution of sample proportion defective? Please...
PLEASE HELP
Use the following to answer questions 20-25: A company makes plastic cups. Four samples of 15 cups were taken from an ongoing process to establish ap chart for control. The samples and the number of defectives in each are shown in the following table: Sample n Number of Defectives 1 15 2 2 15 o 3 15 3 15 5 Question 22 1 pts What is the standard deviation of the sampling distribution of sample proportion defective? Please...
Most questions answered within 3 hours.
-
Based on the range, which of the following sets of scores has
the greatest variability? 3,...
asked 40 minutes ago -
Ripples in a pond travel at a velocity of 3 m/s with one peak
passing a...
asked 30 minutes ago -
A man stands on the roof of a building of height 13.0 mm and
throws a...
asked 36 minutes ago -
The extent to which assets are financed by borrowed funds and
other liabilities is indicated by:...
asked 1 hour ago -
Explain in detail
Germany is the fifth largest economy
explain what goods and services Germany specializes...
asked 1 hour ago -
The density of platinum is 21.45 g/mL. If a cube of platinum
with a mass of...
asked 1 hour ago -
Accounts Receivable
Sales
A/R Posting
Extended Sales Invoice
Packing Slip
Compare invoice to packing slip 2...
asked 2 hours ago -
Michaella, age 23, is a full-time law student and is claimed by
her parents as a...
asked 2 hours ago -
Why are polymers not typically casted into products?
asked 2 hours ago -
When rolling a die 129 times, what is the probability of rolling
a 6 no more...
asked 2 hours ago -
4. A call option currently sells for $7.75. It has a strike
price of $85 and...
asked 2 hours ago -
1.
You need to prepare 10.0 liters of an acid aqueous solution with a
pH of...
asked 2 hours ago