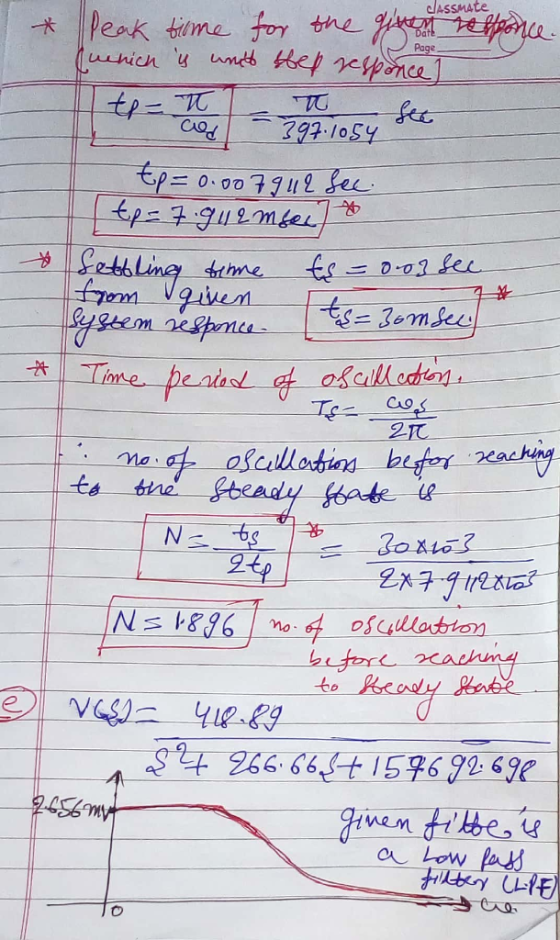
 Explain please
Homework Answers


Add Answer to:
Explain please 2. Assume that the waveform shown at 100 90 the left represents the natural response of particular filter...
6.13 The waveform for the current in a 70-μF capacitor is shown in the figure below....
 6.13 The waveform for the current in a 70-μF capacitor is shown
in the figure below. Determine the waveform for the capacitor
voltage.
The waveform for the current in a 70-uF capacitor is shown in the figure below. Determine the waveform for the capacitor voltage i(t) (mA) 14 0 10 20 30 40 t (ms) t <0ms t < 40 ms t z 40ms v (t) -2500? V -4 V 0 t <0ms 2500t V 0 t < 40 ms...
6.13 The waveform for the current in a 70-μF capacitor is shown
in the figure below. Determine the waveform for the capacitor
voltage.
The waveform for the current in a 70-uF capacitor is shown in the figure below. Determine the waveform for the capacitor voltage i(t) (mA) 14 0 10 20 30 40 t (ms) t <0ms t < 40 ms t z 40ms v (t) -2500? V -4 V 0 t <0ms 2500t V 0 t < 40 ms...
Water at 50 °Fis circulated from a large tank, through a filter, and back to the...
 Water at 50 °Fis circulated from a large tank, through a filter, and back to the tank Calculate the volumetric flow rate through the filter for the following given information: Patm V.. Valve Pump Filter Pump power: W=200 lbf.ft/s Pump efficiency: 1p-0.9 Total pipe length: /= 200 ft Pipe diameter: d=0.1 ft Pipe surface relative roughness: /d=0.01 Elbow loss factor (each): Kelbow=1.5 Valve loss factor: Kvalve-6 Inlet and Exit type: sudden, Fig. 6.22 Filter loss factor Kriter=12 F (velocity, ft/s...
The power versus time for a point on a string (μ = 0.06 kg/m) in which a sinusoidal traveling wave is induced is shown...
 The power versus time for a point on a string (μ = 0.06
kg/m) in which a sinusoidal traveling wave is induced is
shown in the following figure. The wave is modeled with the wave
equation y(x, t) = A sin[(25.43 m−1)x − ωt]. What are
the frequency (in Hz) and amplitude (in m) of the wave?
The power versus time or a point on a string μ 0.06 kg/m n which a sinusoidal traveling wave sind ce s snow...
The power versus time for a point on a string (μ = 0.06
kg/m) in which a sinusoidal traveling wave is induced is
shown in the following figure. The wave is modeled with the wave
equation y(x, t) = A sin[(25.43 m−1)x − ωt]. What are
the frequency (in Hz) and amplitude (in m) of the wave?
The power versus time or a point on a string μ 0.06 kg/m n which a sinusoidal traveling wave sind ce s snow...
help please! And can you explain me how you did it? 1. The current and voltage...
 help please! And can you explain me how you did it?
1. The current and voltage for an element are shown below (assume+ for the passive sign convention) a. b. Draw a plot of power for that elemen Find the total energy delivered to the element in 0 to 60 ms. t on the axes provided. [15 pts.] i (mA) 250 10 20 40 50 60 70 (ms) -250 v (V) t (ms) 20 40 50 60 70 p (W)...
help please! And can you explain me how you did it?
1. The current and voltage for an element are shown below (assume+ for the passive sign convention) a. b. Draw a plot of power for that elemen Find the total energy delivered to the element in 0 to 60 ms. t on the axes provided. [15 pts.] i (mA) 250 10 20 40 50 60 70 (ms) -250 v (V) t (ms) 20 40 50 60 70 p (W)...
A capacitor is charged to an initial voltage Vo - 7.6 V. The capacitor is then...
 A capacitor is charged to an initial voltage Vo - 7.6 V. The capacitor is then discharged by connecting its terminals through a resistor. The currentI (t) through this resistor, determined by measuring the voltage VR(t)- I(t)R with an oscilloscope, is shown in the graph. 85 80 75 70 65 60 50 45 40 35 30 25 20 15 10 ms) 0 5 10 15 20 25 30 35 40 45 50 55 60 65 70 75 80 85 Part...
1_ in part 2 is your graph of s vs t a straight line? if not how would you describe the curve (what does...
 1_ in part 2 is your graph of s vs t a straight line?
if not how would you describe the curve (what does the slope tell
about the velocity )
2_ in part 3 what does your graph of v vs the tell you about the
acceleration
70 60 50 40 30 DISTANCE (cm) 20 Time (sec) Average Time sec CONSTANT ACCELERATION TABLE 2-2 60 70 50 1. DISTANCE (crm). 40 20 30 459226226L-112 1.236 13512 26 1.235 95z...
1_ in part 2 is your graph of s vs t a straight line?
if not how would you describe the curve (what does the slope tell
about the velocity )
2_ in part 3 what does your graph of v vs the tell you about the
acceleration
70 60 50 40 30 DISTANCE (cm) 20 Time (sec) Average Time sec CONSTANT ACCELERATION TABLE 2-2 60 70 50 1. DISTANCE (crm). 40 20 30 459226226L-112 1.236 13512 26 1.235 95z...
21. [2] Look at Figure 30-26 and you will see a capacitor charge and discharge curve...
 21. [2] Look at Figure 30-26 and you will see a capacitor charge and discharge curve in B. for the circuit shown in A. Will the capacitor charge faster, slower or take the same time if the battery voltage in Figure 30-26A is changed from 10 volts to 20 volts and why? 1 time-constant period), the voltage act switched to DISCHARGE, the voltage Example 30-6 Assume a de voltage source of 100 Vis applied to a series RC circuit consisting...
explain the answer a little please 1. Given the circuit below, determine the current through each...
 explain the answer a little please
1. Given the circuit below, determine the current through each of the resistors and the power used by resistor 3. (20 points) R,-50Ω Battery Voltage is 120 V R2-20 Ω R, 30 2 R, 40 Ω R7-70 Ω R8-80 Ω 9:52v LTE Done Attachment . Given the circuit below, determine the current through each of the resistors and the power used by resistor 3. (20 points) Rs = 50 Ω Battery Voltage is 120...
explain the answer a little please
1. Given the circuit below, determine the current through each of the resistors and the power used by resistor 3. (20 points) R,-50Ω Battery Voltage is 120 V R2-20 Ω R, 30 2 R, 40 Ω R7-70 Ω R8-80 Ω 9:52v LTE Done Attachment . Given the circuit below, determine the current through each of the resistors and the power used by resistor 3. (20 points) Rs = 50 Ω Battery Voltage is 120...
1. The current through a 0.1-H coil is provided. Find the sinusoidal expression for the voltage...
1. The current through a 0.1-H coil is provided. Find the sinusoidal expression for the voltage across the coil. Sketch the v and i curves. a. i = 10 sin 377t b. i = 7 sin(377t - 70°) 2. The voltage across a 1-micro F capacitor is provided below. What is the sinusoidal expression for the current? Sketch the v and i curves. v = 30 sin 400t 3. For the following pairs of voltages and currents, determine whether the...
For a 70 wt % You are given the binary eutectic copper-silver phase diagram shown in Figure 2. Cu...
 For a 70 wt % You are given the binary eutectic copper-silver phase diagram shown in Figure 2. Cu-30 wt% Ag alloy at a temperature of 1600°F, determine the following: . The phases present at the provided state point The weight percent of these phases along the tie line. The amounts of each of these phases at the state point. The degree(s) of freedom at the provided state point Atomic percent silver 30 40 50 60 70 80 90 10...
 6.13 The waveform for the current in a 70-μF capacitor is shown
in the figure below. Determine the waveform for the capacitor
voltage.
The waveform for the current in a 70-uF capacitor is shown in the figure below. Determine the waveform for the capacitor voltage i(t) (mA) 14 0 10 20 30 40 t (ms) t <0ms t < 40 ms t z 40ms v (t) -2500? V -4 V 0 t <0ms 2500t V 0 t < 40 ms...
6.13 The waveform for the current in a 70-μF capacitor is shown
in the figure below. Determine the waveform for the capacitor
voltage.
The waveform for the current in a 70-uF capacitor is shown in the figure below. Determine the waveform for the capacitor voltage i(t) (mA) 14 0 10 20 30 40 t (ms) t <0ms t < 40 ms t z 40ms v (t) -2500? V -4 V 0 t <0ms 2500t V 0 t < 40 ms...
 Water at 50 °Fis circulated from a large tank, through a filter, and back to the tank Calculate the volumetric flow rate through the filter for the following given information: Patm V.. Valve Pump Filter Pump power: W=200 lbf.ft/s Pump efficiency: 1p-0.9 Total pipe length: /= 200 ft Pipe diameter: d=0.1 ft Pipe surface relative roughness: /d=0.01 Elbow loss factor (each): Kelbow=1.5 Valve loss factor: Kvalve-6 Inlet and Exit type: sudden, Fig. 6.22 Filter loss factor Kriter=12 F (velocity, ft/s...
 The power versus time for a point on a string (μ = 0.06
kg/m) in which a sinusoidal traveling wave is induced is
shown in the following figure. The wave is modeled with the wave
equation y(x, t) = A sin[(25.43 m−1)x − ωt]. What are
the frequency (in Hz) and amplitude (in m) of the wave?
The power versus time or a point on a string μ 0.06 kg/m n which a sinusoidal traveling wave sind ce s snow...
The power versus time for a point on a string (μ = 0.06
kg/m) in which a sinusoidal traveling wave is induced is
shown in the following figure. The wave is modeled with the wave
equation y(x, t) = A sin[(25.43 m−1)x − ωt]. What are
the frequency (in Hz) and amplitude (in m) of the wave?
The power versus time or a point on a string μ 0.06 kg/m n which a sinusoidal traveling wave sind ce s snow...
 help please! And can you explain me how you did it?
1. The current and voltage for an element are shown below (assume+ for the passive sign convention) a. b. Draw a plot of power for that elemen Find the total energy delivered to the element in 0 to 60 ms. t on the axes provided. [15 pts.] i (mA) 250 10 20 40 50 60 70 (ms) -250 v (V) t (ms) 20 40 50 60 70 p (W)...
help please! And can you explain me how you did it?
1. The current and voltage for an element are shown below (assume+ for the passive sign convention) a. b. Draw a plot of power for that elemen Find the total energy delivered to the element in 0 to 60 ms. t on the axes provided. [15 pts.] i (mA) 250 10 20 40 50 60 70 (ms) -250 v (V) t (ms) 20 40 50 60 70 p (W)...
 A capacitor is charged to an initial voltage Vo - 7.6 V. The capacitor is then discharged by connecting its terminals through a resistor. The currentI (t) through this resistor, determined by measuring the voltage VR(t)- I(t)R with an oscilloscope, is shown in the graph. 85 80 75 70 65 60 50 45 40 35 30 25 20 15 10 ms) 0 5 10 15 20 25 30 35 40 45 50 55 60 65 70 75 80 85 Part...
 1_ in part 2 is your graph of s vs t a straight line?
if not how would you describe the curve (what does the slope tell
about the velocity )
2_ in part 3 what does your graph of v vs the tell you about the
acceleration
70 60 50 40 30 DISTANCE (cm) 20 Time (sec) Average Time sec CONSTANT ACCELERATION TABLE 2-2 60 70 50 1. DISTANCE (crm). 40 20 30 459226226L-112 1.236 13512 26 1.235 95z...
1_ in part 2 is your graph of s vs t a straight line?
if not how would you describe the curve (what does the slope tell
about the velocity )
2_ in part 3 what does your graph of v vs the tell you about the
acceleration
70 60 50 40 30 DISTANCE (cm) 20 Time (sec) Average Time sec CONSTANT ACCELERATION TABLE 2-2 60 70 50 1. DISTANCE (crm). 40 20 30 459226226L-112 1.236 13512 26 1.235 95z...
 21. [2] Look at Figure 30-26 and you will see a capacitor charge and discharge curve in B. for the circuit shown in A. Will the capacitor charge faster, slower or take the same time if the battery voltage in Figure 30-26A is changed from 10 volts to 20 volts and why? 1 time-constant period), the voltage act switched to DISCHARGE, the voltage Example 30-6 Assume a de voltage source of 100 Vis applied to a series RC circuit consisting...
 explain the answer a little please
1. Given the circuit below, determine the current through each of the resistors and the power used by resistor 3. (20 points) R,-50Ω Battery Voltage is 120 V R2-20 Ω R, 30 2 R, 40 Ω R7-70 Ω R8-80 Ω 9:52v LTE Done Attachment . Given the circuit below, determine the current through each of the resistors and the power used by resistor 3. (20 points) Rs = 50 Ω Battery Voltage is 120...
explain the answer a little please
1. Given the circuit below, determine the current through each of the resistors and the power used by resistor 3. (20 points) R,-50Ω Battery Voltage is 120 V R2-20 Ω R, 30 2 R, 40 Ω R7-70 Ω R8-80 Ω 9:52v LTE Done Attachment . Given the circuit below, determine the current through each of the resistors and the power used by resistor 3. (20 points) Rs = 50 Ω Battery Voltage is 120...
 For a 70 wt % You are given the binary eutectic copper-silver phase diagram shown in Figure 2. Cu-30 wt% Ag alloy at a temperature of 1600°F, determine the following: . The phases present at the provided state point The weight percent of these phases along the tie line. The amounts of each of these phases at the state point. The degree(s) of freedom at the provided state point Atomic percent silver 30 40 50 60 70 80 90 10...
Most questions answered within 3 hours.
-
How do I convert from volume percent to mole percent in the
distillation lab? ethy acetate...
asked 27 seconds from now -
8. An air-plane has an effective wing surface area of 14.0 m²
that is generating the...
asked 27 seconds ago -
using RECURSIVE Functions in Java, create a public static String
doubleLetters (String word)
For ex) that...
asked 5 minutes ago -
With a $16 Trillion national ebt, and projected annual budget
eficits in excess of $1 Trillion...
asked 20 minutes ago -
A machine shop owner wishes to assign each of three machinists
(labeled 1, 2, and 3)...
asked 34 minutes ago -
Regarding language development, which of the following
statements is FALSE?
Babies are able to cry from...
asked 33 minutes ago -
A couple of small ice cubes at 0 °C are added to glass of warm
water...
asked 32 minutes ago -
Slow 'n Steady, Inc., has a stock price of $30, will pay a
dividend next year...
asked 35 minutes ago -
During the current financial year, the owner of Omega
Enterprises withdrew supplies of $2,000 for personal...
asked 31 minutes ago -
PLEASE SHOW MATH CALCULATION(formulas)it has to be done on excel
P12-4 Last year (2016), Richter Condos...
asked 39 minutes ago -
A 0.25μF capacitor is charged to 50 V . It is then connected in
series with...
asked 56 minutes ago -
Calculate the current, I, through the batteries for:
- a 2-bulb parallel circuit
- How does...
asked 57 minutes ago