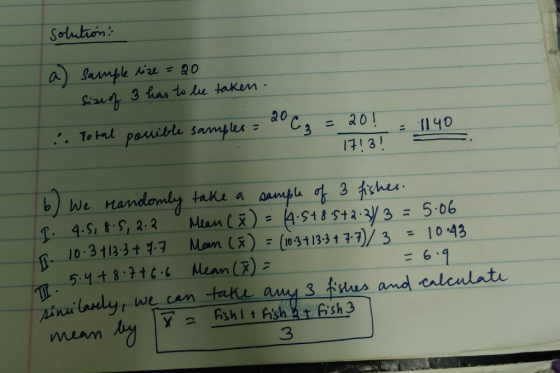
A campus of Wolf City College has a fish pond. Suppose there are 20 fish in...
Homework Answers
Add Answer to:
A campus of Wolf City College has a fish pond. Suppose there are 20 fish in...
The data on the below shows the number of hours a particular drug is in the...
The data on the below shows the number of hours a particular drug is in the system of 200 females. Develop a histogram of this data according to the following intervals: Follow the directions. Test the hypothesis that these data are distributed exponentially. Determine the test statistic. Round to two decimal places. (sort the data first) [0, 3) [3, 6) [6, 9) [9, 12) [12, 18) [18, 24) [24, infinity) 34.7 11.8 10 7.8 2.8 20 9.8 20.4 1.2 7.2...
Parametirc test or not: Test statistic: p-value: decision: Is There A Difference Between the Means?
Parametirc test or not:Test statistic:p-value:decision:Is There A Difference Between the Means?6.7 6.2 3.1 310.3 10 5 5.56.9 5.5 3.3 3.110.5 6.3 4.3 5.44.5 4.6 1.8 25.6 5.6 2 2.65.9 6.1 2.1 2.58 11.7 4 4.68 7.4 3.3 3.15.8 5.2 3.1 2.96 7.3 3.0 3.28.7 5.3 2.7 36 5.5 2.1 2.27.2 6.3 3.5 3.25.9 4.6 2.9 3.46 7.4 3 3.37.2 7.8 3.7 3.48.6 9.4 5.1 5.77.2 8.1 2.8 3.15.8 5.4 2.2 1.83.3 4 1.7 1.86.8 5.1 2 1.83.7 3.5 2.2 2.112...
The following data represent soil water content (percentage of water by volume) for independent random samples...
The following data represent soil water content (percentage of water by volume) for independent random samples of soil taken from two experimental fields growing bell peppers. Soil water content from field I: x1; n1 = 72 15.2 11.3 10.1 10.8 16.6 8.3 9.1 12.3 9.1 14.3 10.7 16.1 10.2 15.2 8.9 9.5 9.6 11.3 14.0 11.3 15.6 11.2 13.8 9.0 8.4 8.2 12.0 13.9 11.6 16.0 9.6 11.4 8.4 8.0 14.1 10.9 13.2 13.8 14.6 10.2 11.5 13.1 14.7 12.5...
(a) A recent study of home technologies reported (as per the following table) the number of...
(a) A recent study of home technologies reported (as per the following table) the number of hours of personal computer usage per week for a sample of 60 persons. 9.3 5.3 6.3 8.8 6.5 0.6 5.2 6.6 9.3 4.3 6.3 2.1 2.7 0.4 3.7 3.3 1.1 2.7 6.7 6.5 4.3 9.7 7.7 5.2 1.7 8.5 4.2 5.5 5.1 5.6 5.4 4.8 2.1 10.1 1.3 5.6 2.4 2.4 4.7 1.7 2.0 6.7 1.1 6.7 2.2 2.6 9.8 6.4 4.9 5.2 4.5...
The data contained in the file named StateUnemp show the unemployment rate in March 2011 and...
The data contained in the file named StateUnemp show the unemployment rate in March 2011 and the unemployment rate in March 2012 for every state.† State Unemploy- ment Rate March 2011 Unemploy- ment Rate March 2012 Alabama 9.3 7.3 Alaska 7.6 7.0 Arizona 9.6 8.6 Arkansas 8.0 7.4 California 11.9 11.0 Colorado 8.5 7.8 Connecticut 9.1 7.7 Delaware 7.3 6.9 Florida 10.7 ...
Consider the accompanying data on flexural strength (MPa) for concrete beams of a certain type. 6.0...
Consider the accompanying data on flexural strength (MPa) for concrete beams of a certain type. 6.0 7.2 7.3 6.3 8.1 6.8 7.0 7.5 6.8 6.5 7.0 6.3 7.9 9.0 9.0 8.7 7.8 9.7 7.4 7.7 9.7 8.2 7.7 11.6 11.3 11.8 10.7 The data below give accompanying strength observations for cylinders. 6.1 5.8 7.8 7.1 7.2 9.2 6.6 8.3 7.0 8.5 7.5 8.1 7.4 8.5 8.9 9.8 9.7 14.1 12.6 11.9 Prior to obtaining data, denote the beam strengths by...
An object of weight 1 N is falling vertically. The time vs. speed data can be...
An object of weight 1 N is falling vertically. The time vs. speed data can be found here. In this case the effect of air-drag cannot be neglected. Use your critical thinking to estimate the air-drag coefficient . Make sure you include the units in your answer. 0 0 0.1 0.9992 0.2 1.993 0.3 2.978 0.4 3.948 0.5 4.898 0.6 5.826 0.7 6.728 0.8 7.599 0.9 8.438 1 9.242 1.1 10.01 1.2 10.74 1.3 11.43 1.4 12.09 1.5 12.7 1.6 ...
Please solve In their discussion of the Lindley distribution, Ghitany et al. (2008) considered the data...
 Please solve
In their discussion of the Lindley distribution, Ghitany et al. (2008) considered the data given in Table 1 and available on Blackboard as the Robject waitingtimes.dat. It summarises the waiting time, in minutes, of 100 bank customers before they were served. 0.8 2.9 4.3 5.0 6.7 8.2 9.7 11.9 14.1 19.9 0.8 3.1 4.3 5.3 6.9 8.6 9.8 12.4 15.4 20.6 1.3 3.2 4.4 5.5 7.1 8.6 10.7 12.5 15.4 21.3 1.5 3.3 4.4 5.7 7.1 8.6 10.9...
Please solve
In their discussion of the Lindley distribution, Ghitany et al. (2008) considered the data given in Table 1 and available on Blackboard as the Robject waitingtimes.dat. It summarises the waiting time, in minutes, of 100 bank customers before they were served. 0.8 2.9 4.3 5.0 6.7 8.2 9.7 11.9 14.1 19.9 0.8 3.1 4.3 5.3 6.9 8.6 9.8 12.4 15.4 20.6 1.3 3.2 4.4 5.5 7.1 8.6 10.7 12.5 15.4 21.3 1.5 3.3 4.4 5.7 7.1 8.6 10.9...
Question 1 Test, at the 5% level of significance, whether location (Parramatta or Sydney CBD) of...
 Question 1 Test, at the 5% level of significance,
whether location (Parramatta or Sydney CBD) of the business is
related to the type of business (privately held, publicly traded or
franchise)?
Column 1 Profit What was your profit?
Column 2 Type Is the business privately held, publicly
traded or a franchise? (Private = 1, Public = 2, Franchise =
3)
Column 3 Employee How many employees work at your
business?
Column 4 Age How old is the company (in years)?...
Question 1 Test, at the 5% level of significance,
whether location (Parramatta or Sydney CBD) of the business is
related to the type of business (privately held, publicly traded or
franchise)?
Column 1 Profit What was your profit?
Column 2 Type Is the business privately held, publicly
traded or a franchise? (Private = 1, Public = 2, Franchise =
3)
Column 3 Employee How many employees work at your
business?
Column 4 Age How old is the company (in years)?...
We consider the multiple linear regression with LIFE (y) as the response variable, and MALE, BIRT...
We consider the multiple linear regression with LIFE (y) as the response variable, and MALE, BIRTH, DIVO , BEDS, EDUC, and INCO, as predictors. QUESTION: Plot the standardized residuals against the fitted values. Are there any notable points. In particular look for points with large residuals or that may be influential. # please screenshot the Rcode for the plot. # data information are as follows: "STATE" "MALE" "BIRTH" "DIVO" "BEDS" "EDUC" "INCO" "LIFE" AK 119.1 24.8 5.6 603.3 14.1 4638...
 Please solve
In their discussion of the Lindley distribution, Ghitany et al. (2008) considered the data given in Table 1 and available on Blackboard as the Robject waitingtimes.dat. It summarises the waiting time, in minutes, of 100 bank customers before they were served. 0.8 2.9 4.3 5.0 6.7 8.2 9.7 11.9 14.1 19.9 0.8 3.1 4.3 5.3 6.9 8.6 9.8 12.4 15.4 20.6 1.3 3.2 4.4 5.5 7.1 8.6 10.7 12.5 15.4 21.3 1.5 3.3 4.4 5.7 7.1 8.6 10.9...
Please solve
In their discussion of the Lindley distribution, Ghitany et al. (2008) considered the data given in Table 1 and available on Blackboard as the Robject waitingtimes.dat. It summarises the waiting time, in minutes, of 100 bank customers before they were served. 0.8 2.9 4.3 5.0 6.7 8.2 9.7 11.9 14.1 19.9 0.8 3.1 4.3 5.3 6.9 8.6 9.8 12.4 15.4 20.6 1.3 3.2 4.4 5.5 7.1 8.6 10.7 12.5 15.4 21.3 1.5 3.3 4.4 5.7 7.1 8.6 10.9...
 Question 1 Test, at the 5% level of significance,
whether location (Parramatta or Sydney CBD) of the business is
related to the type of business (privately held, publicly traded or
franchise)?
Column 1 Profit What was your profit?
Column 2 Type Is the business privately held, publicly
traded or a franchise? (Private = 1, Public = 2, Franchise =
3)
Column 3 Employee How many employees work at your
business?
Column 4 Age How old is the company (in years)?...
Question 1 Test, at the 5% level of significance,
whether location (Parramatta or Sydney CBD) of the business is
related to the type of business (privately held, publicly traded or
franchise)?
Column 1 Profit What was your profit?
Column 2 Type Is the business privately held, publicly
traded or a franchise? (Private = 1, Public = 2, Franchise =
3)
Column 3 Employee How many employees work at your
business?
Column 4 Age How old is the company (in years)?...
Most questions answered within 3 hours.
-
Required information
[The following information applies to the questions
displayed below.]
Satellite Systems modified its model...
asked 1 minute ago -
When one molecule of methane combusts with oxygen, 5.74 X
10-21 J is released as heat....
asked 7 minutes ago -
High Normal blood pressure is categorized as which of
the following?
140-159/90-99
120/80
130-139/85-89
160/100
asked 10 minutes ago -
Please I need help with MATLAB .. PLease help me . Thankyou
Write Matlab code to...
asked 7 minutes ago -
You are saving towards purchasing a house and currently have
$20,000 in an account that earns...
asked 17 minutes ago -
Draw three resonance structures for each of
the following:
(a) -CH2NO2 (b) CH3CO2CH3
(c) -CH2CO2- (d)...
asked 24 minutes ago -
There has been discussion about people moving from Earth to Mars
in the future. An organization...
asked 23 minutes ago -
Starting Out with c++ Student Line Up Using Files A teacher has
asked all her students...
asked 25 minutes ago -
Two point charges totaling 9.00 µC exert a repulsive force of
0.200 N on one another...
asked 26 minutes ago -
In Visual Studio 2017
Populate a two-dimensional array with the following prices in
this table order:...
asked 36 minutes ago -
Answer below in detail
1. Reverse Logistics - Introduction
2. The world before and after reverse...
asked 41 minutes ago -
Find the area of the shaded region. The graph to the right
depicts IQ scores of...
asked 52 minutes ago