
ch 11, q3
Hi! the second example shows the entire qestion to the first problem, please answer the first question with those 3 steps. :-)
Homework Answers
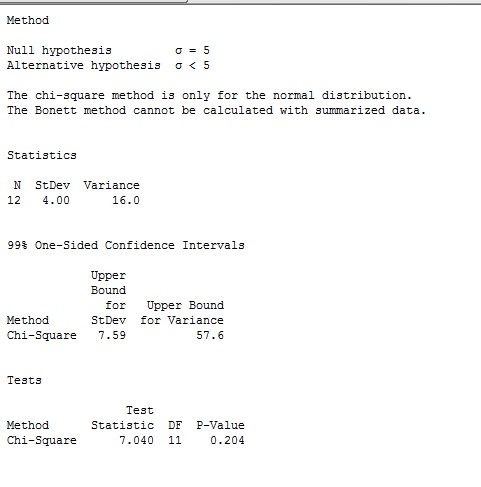
I have used minitab software
Steps
- Stat-Basic Statistics-1 variance

- options

- ok-ok


minitab output
-------------------------------------------------------------
test statistic=7.040
critical value=24.725
Do not reject H0. the test statistic is greater than the critical value.
---------------------------------------------------------------
PLEASE UPVOTE IF YOU LIKE MY ANSWER
THANK YOU
Add Answer to:
ch 11, q3 Hi! the second example shows the entire qestion to the first problem, please...
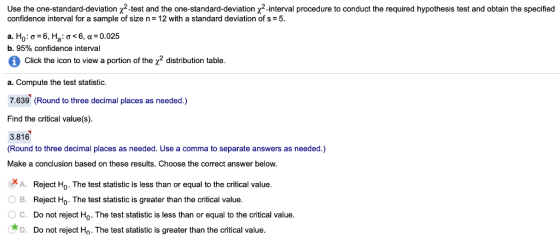
Question Help Use the one-standard deviation ?-test and the one-standard deviation je interval procedure to conduct...
 Question Help Use the one-standard deviation ?-test and the one-standard deviation je interval procedure to conduct the required hypothesis tout and obtain the specified confidence interval for a sample of on-25 wa standard deviation of s7 a. Hy 5, H > 5,0 -0.025 b. 95% confidence interval Click the icon to view a portion of the y distribution table. a. Compute the test statistic (Round to three decimal places as needed.) Find the critical value(s) (Round to three decimal places...
ch 12 q 11 Hi! the second example shows the entire qestion to the first problem,...
 ch 12 q 11 Hi! the second example shows the entire qestion to
the first problem, please answer the first question with those
steps. :-)
According to a survey of 650 Web users from Generation Y, 338 reported using the Internet to download music. a. Determine the sample proportion b. At the 1% significance level, do the data provide sufficient evidence to conclude that a majority of Generation Y Web users use the Internet to download music? Use the one-proportion...
ch 12 q 11 Hi! the second example shows the entire qestion to
the first problem, please answer the first question with those
steps. :-)
According to a survey of 650 Web users from Generation Y, 338 reported using the Internet to download music. a. Determine the sample proportion b. At the 1% significance level, do the data provide sufficient evidence to conclude that a majority of Generation Y Web users use the Internet to download music? Use the one-proportion...
Hi! the second example shows the entire qestion to the first problem, please answer the first...
 Hi! the second example shows the entire qestion to the first
problem, please answer the first question with those steps. :-)
An insurance company collects data on seat-belt use among drivers in a country. Of 1 100 drivers 20-29 years old, 19% said that they buckle up, whereas 341 of 1300 drivers 45-64 years old said that they did. At the 19 sign cance e el do he data suggest a there sa difference in sea e use et een...
Hi! the second example shows the entire qestion to the first
problem, please answer the first question with those steps. :-)
An insurance company collects data on seat-belt use among drivers in a country. Of 1 100 drivers 20-29 years old, 19% said that they buckle up, whereas 341 of 1300 drivers 45-64 years old said that they did. At the 19 sign cance e el do he data suggest a there sa difference in sea e use et een...
ch 14, q 4 Hi! the second example shows the entire qestion to the first problem,...
 ch 14, q 4
Hi! the second example shows the entire qestion to the first
problem, please answer the first question with those steps. :-)
In a trial of 144 patients who received 10-mg doses of a drug daily, 36 reported a headache as a side effect. Use the information above to answer the following questions (a) Verify that the requirements for constructing a confidence interval about p are satisfied. Are the requirements for constructing a confidence interval about p...
ch 14, q 4
Hi! the second example shows the entire qestion to the first
problem, please answer the first question with those steps. :-)
In a trial of 144 patients who received 10-mg doses of a drug daily, 36 reported a headache as a side effect. Use the information above to answer the following questions (a) Verify that the requirements for constructing a confidence interval about p are satisfied. Are the requirements for constructing a confidence interval about p...
ch 12 q 3 Hi! the second example shows the entire qestion to the first problem,...
 ch 12 q 3
Hi! the second example shows the entire qestion to the first
problem, please answer the first question with those steps. :-)
The number of successes and the sample size for a simple random sample from a population are given. a. Determine the sample proportion. b. Decide whether using the one-proportion z-interval procedure is appropriate. c. If appropriate, use the one-proportion z-interval procedure to find the confidence interval at the specified confidence level. x= 175, n= 250,...
ch 12 q 3
Hi! the second example shows the entire qestion to the first
problem, please answer the first question with those steps. :-)
The number of successes and the sample size for a simple random sample from a population are given. a. Determine the sample proportion. b. Decide whether using the one-proportion z-interval procedure is appropriate. c. If appropriate, use the one-proportion z-interval procedure to find the confidence interval at the specified confidence level. x= 175, n= 250,...
S. Find the critical value or values of χ2 based on the given information. (1 point)...
 S. Find the critical value or values of χ2 based on the given information. (1 point) Hi: σ < 0.629 n- 19 α 0.025 8.231 8.907 3 1.526 7.015 0 Use the traditional method to test the given hypothesis. Assume that the population is normally distributed and that the sample has been randomly selected. Select the appropriate response. 29. For randomly selected adults, IQ scores are normally distributed with a standard deviation of 15. The scores of 14 randomly selected...
In order to conduct a hypothesis test of the population mean, a random sample of 26 observations is drawn from a n...
 In order to conduct a hypothesis test of the population mean, a random sample of 26 observations is drawn from a normally distributed population. The resulting mean and the standard deviation are calculated as 6.2 and 2.2, respectively. Use Table 2. Use the critical value approach to conduct the following tests at a =0.10. bolnts Ho:us 5.8 against HA > 5.8 2-1. Calculate the value of the test statistic. (Round your intermediate calculations to 4 decimal places and final answer...
Consider the hypothesis please ignore the answers in the photos they are from a previous problem,...
 Consider the hypothesis
please ignore the answers in the photos they are from a previous
problem, thank u!!!
Ho: o2 37.0 H1: o237.0 Consider the hypothesis statement to the right. State your conclusion given that s 7.5, n 28, and a 0.10 Click the icon to view a table of chi-square critical values. Calculate the appropriate test statistic The test statistic is (Round to two decimal places as needed.) Calculate the appropriate test statistic. The test statistic is 18.00. (Round...
Consider the hypothesis
please ignore the answers in the photos they are from a previous
problem, thank u!!!
Ho: o2 37.0 H1: o237.0 Consider the hypothesis statement to the right. State your conclusion given that s 7.5, n 28, and a 0.10 Click the icon to view a table of chi-square critical values. Calculate the appropriate test statistic The test statistic is (Round to two decimal places as needed.) Calculate the appropriate test statistic. The test statistic is 18.00. (Round...
A sample of 16 items provides a sample standard deviation of 9.5. Test the following hypotheses...
 A sample of 16 items provides a sample standard deviation of 9.5. Test the following hypotheses using a 0.05. What is your conclusion? Ho: o s 50 H,:o? > 50 Use the p-value approach. Find the value of the test statistic. 27.075 Find the p-value. (Round your answer to three decimal places.) p-value = 0.028 State your conclusion O Reject No. We conclude that the population variance is greater than 50 Do not reject No. We conclude that the population...
Assume that you have a sample of n 1-7, with the sample mean X1-43, and a...
 Assume that you have a sample of n 1-7, with the sample mean X1-43, and a sample standard deviation of S1-4, and you have an independent sample of n2-13 from another population with a sample mean of x2 39 and the sample standard deviation S2-7. Complete parts (a) through (d). Click here for page 1 of critical values oft. Click here for page 2 of critical values of t. a. What is the value of the pooled-variance ISTAT test statistic...
 Question Help Use the one-standard deviation ?-test and the one-standard deviation je interval procedure to conduct the required hypothesis tout and obtain the specified confidence interval for a sample of on-25 wa standard deviation of s7 a. Hy 5, H > 5,0 -0.025 b. 95% confidence interval Click the icon to view a portion of the y distribution table. a. Compute the test statistic (Round to three decimal places as needed.) Find the critical value(s) (Round to three decimal places...
 ch 12 q 11 Hi! the second example shows the entire qestion to
the first problem, please answer the first question with those
steps. :-)
According to a survey of 650 Web users from Generation Y, 338 reported using the Internet to download music. a. Determine the sample proportion b. At the 1% significance level, do the data provide sufficient evidence to conclude that a majority of Generation Y Web users use the Internet to download music? Use the one-proportion...
ch 12 q 11 Hi! the second example shows the entire qestion to
the first problem, please answer the first question with those
steps. :-)
According to a survey of 650 Web users from Generation Y, 338 reported using the Internet to download music. a. Determine the sample proportion b. At the 1% significance level, do the data provide sufficient evidence to conclude that a majority of Generation Y Web users use the Internet to download music? Use the one-proportion...
 Hi! the second example shows the entire qestion to the first
problem, please answer the first question with those steps. :-)
An insurance company collects data on seat-belt use among drivers in a country. Of 1 100 drivers 20-29 years old, 19% said that they buckle up, whereas 341 of 1300 drivers 45-64 years old said that they did. At the 19 sign cance e el do he data suggest a there sa difference in sea e use et een...
Hi! the second example shows the entire qestion to the first
problem, please answer the first question with those steps. :-)
An insurance company collects data on seat-belt use among drivers in a country. Of 1 100 drivers 20-29 years old, 19% said that they buckle up, whereas 341 of 1300 drivers 45-64 years old said that they did. At the 19 sign cance e el do he data suggest a there sa difference in sea e use et een...
 ch 14, q 4
Hi! the second example shows the entire qestion to the first
problem, please answer the first question with those steps. :-)
In a trial of 144 patients who received 10-mg doses of a drug daily, 36 reported a headache as a side effect. Use the information above to answer the following questions (a) Verify that the requirements for constructing a confidence interval about p are satisfied. Are the requirements for constructing a confidence interval about p...
ch 14, q 4
Hi! the second example shows the entire qestion to the first
problem, please answer the first question with those steps. :-)
In a trial of 144 patients who received 10-mg doses of a drug daily, 36 reported a headache as a side effect. Use the information above to answer the following questions (a) Verify that the requirements for constructing a confidence interval about p are satisfied. Are the requirements for constructing a confidence interval about p...
 ch 12 q 3
Hi! the second example shows the entire qestion to the first
problem, please answer the first question with those steps. :-)
The number of successes and the sample size for a simple random sample from a population are given. a. Determine the sample proportion. b. Decide whether using the one-proportion z-interval procedure is appropriate. c. If appropriate, use the one-proportion z-interval procedure to find the confidence interval at the specified confidence level. x= 175, n= 250,...
ch 12 q 3
Hi! the second example shows the entire qestion to the first
problem, please answer the first question with those steps. :-)
The number of successes and the sample size for a simple random sample from a population are given. a. Determine the sample proportion. b. Decide whether using the one-proportion z-interval procedure is appropriate. c. If appropriate, use the one-proportion z-interval procedure to find the confidence interval at the specified confidence level. x= 175, n= 250,...
 S. Find the critical value or values of χ2 based on the given information. (1 point) Hi: σ < 0.629 n- 19 α 0.025 8.231 8.907 3 1.526 7.015 0 Use the traditional method to test the given hypothesis. Assume that the population is normally distributed and that the sample has been randomly selected. Select the appropriate response. 29. For randomly selected adults, IQ scores are normally distributed with a standard deviation of 15. The scores of 14 randomly selected...
 In order to conduct a hypothesis test of the population mean, a random sample of 26 observations is drawn from a normally distributed population. The resulting mean and the standard deviation are calculated as 6.2 and 2.2, respectively. Use Table 2. Use the critical value approach to conduct the following tests at a =0.10. bolnts Ho:us 5.8 against HA > 5.8 2-1. Calculate the value of the test statistic. (Round your intermediate calculations to 4 decimal places and final answer...
 Consider the hypothesis
please ignore the answers in the photos they are from a previous
problem, thank u!!!
Ho: o2 37.0 H1: o237.0 Consider the hypothesis statement to the right. State your conclusion given that s 7.5, n 28, and a 0.10 Click the icon to view a table of chi-square critical values. Calculate the appropriate test statistic The test statistic is (Round to two decimal places as needed.) Calculate the appropriate test statistic. The test statistic is 18.00. (Round...
Consider the hypothesis
please ignore the answers in the photos they are from a previous
problem, thank u!!!
Ho: o2 37.0 H1: o237.0 Consider the hypothesis statement to the right. State your conclusion given that s 7.5, n 28, and a 0.10 Click the icon to view a table of chi-square critical values. Calculate the appropriate test statistic The test statistic is (Round to two decimal places as needed.) Calculate the appropriate test statistic. The test statistic is 18.00. (Round...
 A sample of 16 items provides a sample standard deviation of 9.5. Test the following hypotheses using a 0.05. What is your conclusion? Ho: o s 50 H,:o? > 50 Use the p-value approach. Find the value of the test statistic. 27.075 Find the p-value. (Round your answer to three decimal places.) p-value = 0.028 State your conclusion O Reject No. We conclude that the population variance is greater than 50 Do not reject No. We conclude that the population...
 Assume that you have a sample of n 1-7, with the sample mean X1-43, and a sample standard deviation of S1-4, and you have an independent sample of n2-13 from another population with a sample mean of x2 39 and the sample standard deviation S2-7. Complete parts (a) through (d). Click here for page 1 of critical values oft. Click here for page 2 of critical values of t. a. What is the value of the pooled-variance ISTAT test statistic...
Most questions answered within 3 hours.
-
A 0.035 mol sample of a weak acid, HA, is dissolved in 437 mL of
water...
asked 54 seconds from now -
a sample of Ar gas has a volume of 6.30 L with an unknown
pressure. the...
asked 12 seconds from now -
The
serum cholesterol levels of a population of kids follow a normal
distribution with mean 155...
asked 19 minutes ago -
han discusses the racist practice of badlands, a bar
in the Castro
district of San Francisco,...
asked 31 minutes ago -
A sample of final exam scores is normally distributed with a
mean equal to 25 and...
asked 35 minutes ago -
An investor shorts 100 shares of a stock when the share price is
$50 and closes...
asked 39 minutes ago -
LLOP corporation just paid 4$ dividend per share, you expect the
dividend to grow 8% for...
asked 48 minutes ago -
if we subtract 1000 from 0001 is there overflow? (binary)
asked 56 minutes ago -
Hello, I need help with the function below, The language I am
using is Ocaml
open...
asked 57 minutes ago -
Explain how the presence of glucose represses the gal structural
genes?
asked 1 hour ago -
For the reaction CaI2+2AgNO3⟶2AgI+Ca(NO3)2 how many grams of
silver iodide, AgI, are produced from 56.5 g...
asked 1 hour ago -
Write an equation for hydrolysis via acid catalysis.
Using ethyl acetate, ethyl benzoate, ethyl formate or...
asked 1 hour ago