Option #2: Red Soda Company vs. Blue Soda Company The Red Soda Company (Red Soda) and...
Option #2: Red Soda Company vs. Blue Soda Company
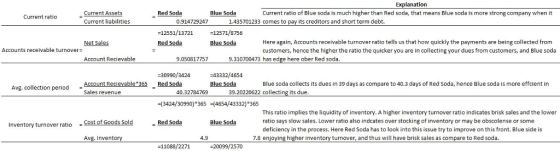
The Red Soda Company (Red Soda) and The Blue Soda Company (Blue Soda) provide refreshments to every corner of the world. Selected data from the 20X6 consolidated financial statements for Red Soda and Blue Soda are presented here (in millions).
|
Red Soda |
Blue Soda |
|
|
Total current assets |
$12,551 |
$12,571 |
|
Total current liabilities |
13,721 |
8,756 |
|
Net Sales |
30,990 |
43,332 |
|
Cost of Goods Sold |
11,088 |
20,099 |
|
Net income |
6,824 |
5,946 |
|
Average (net) accounts receivable for the year |
3,424 |
4,654 |
|
Average inventories for the year |
2,271 |
2,570 |
|
Average total assets |
44,595 |
37,921 |
|
Average common stockholders’ equity |
22,636 |
14,556 |
|
Average current liabilities |
13,335 |
8,772 |
|
Average total liabilities |
21,960 |
23,466 |
|
Total assets |
48,671 |
39,848 |
|
Total liabilities |
23,872 |
23,044 |
|
Income taxes |
2,040 |
2,100 |
|
Interest expense |
355 |
397 |
|
Net cash provided by operating activities |
8,186 |
6,796 |
|
Capital expenditures |
1,993 |
2,128 |
|
Cash dividends |
3,800 |
2,732 |
Instructions:
Compute the following liquidity ratios for 20X6 for Red Soda and Blue Soda, comment on the relative liquidity of two competitors.
Current ratio
Accounts receivable turnover
Average collection period
Inventory turnover
Days in inventory
Current cash debt coverage
Compute the following solvency ratios for the two companies and comment on the relative solvency of the two competitors.
Debt to asset ratio
Times interest earned
Cash debt coverage
Free cash flow
Compute the following profitability ratios for the two companies and comment on the relative probability of the two competitors.
Profit margin
Asset turnover
Return on assets
Return on common stockholders’ equity.
Interpret your findings for the ratio comparatives analysis for Red Soda and Blue Soda.
Evaluate what, if any, options with regard to financial activities should Red Soda and Blue Soda consider (i.e., how can these companies improve financial performance)? What impact would each of these have on the above ratios?
Show your work and use Excel or Word for your submission. The written portion of your assignment should be four to six pages in length with document and citation formatting conformity with the CSU-Global Guide to Writing and APA Requirements.
Homework Answers
Add Answer to:
Option #2: Red Soda Company vs. Blue Soda Company The Red Soda Company (Red Soda) and...
The Red Soda Company (Red Soda) and The Blue Soda Company (Blue Soda) provide refreshments to...
The Red Soda Company (Red Soda) and The Blue Soda Company (Blue Soda) provide refreshments to every corner of the world. Selected data from the 20X6 consolidated financial statements for Red Soda and Blue Soda are presented here (in millions). Red Soda Blue Soda Total current assets $12,551 $12,571 Total current liabilities 13,721 8,756 Net Sales 30,990 43,332 Cost of Goods Sold 11,088 20,099 Net income 6,824 5,946 Average (net) accounts receivable for the year 3,424...
The current year financial statements for Blue Water Company and Prime Fish Company are presented below. Blue Water Prime Fish Balance sheet: Cash Accounts receivable (net) Inventory Property &e...
 The current year financial statements for Blue Water Company and Prime Fish Company are presented below. Blue Water Prime Fish Balance sheet: Cash Accounts receivable (net) Inventory Property &equipment (net) Other assets Total assets Current liabilities Long-term debt (interest rate: 15%) Capital stock ($10 par value) Additional paid-in capital Retained earnings Total liabilities and stockholders' equity Income statement: Sales revenue (1/2 on credit) Cost of goods sold Operating expenses Net income Other data: Per share stock price at end of...
I need answer for B 80 2 A Further Look at Financial Statements (a) Comment on...
 I need answer for B
80 2 A Further Look at Financial Statements (a) Comment on the relative profitability of the companies by computing the net income (b) Comment on the relative liquidity of the companies by computing working capital and (c) Comment on the relative solvency of the companies by computing the debt to assets and earnings per share for each company for 2017 the current ratio for each c ratio and the free cash flow for each company...
I need answer for B
80 2 A Further Look at Financial Statements (a) Comment on the relative profitability of the companies by computing the net income (b) Comment on the relative liquidity of the companies by computing working capital and (c) Comment on the relative solvency of the companies by computing the debt to assets and earnings per share for each company for 2017 the current ratio for each c ratio and the free cash flow for each company...
The current year financial statements for Blue Water Company and Prime Fish Company are presented below....
 The current year financial statements for Blue Water Company and Prime Fish Company are presented below. Blue Water Prime Fish Balance sheet: Cash Accounts receivable (net) Inventory Property & equipment (net) Other assets Total assets 21,000 31,000 40,000 401,000 305,000 $ 798,000 49,000 60,000 512,000 106,000 71,000 $ 798,000 $ 41,000 38,000 99,000 140,000 84,000 $ 402,000 99,000 65,000 148,000 29,000 61,000 $ 402,000 $ Current liabilities $ Long-term debt (interest rate: 10%) Capital stock ($10 par value) Additional paid-in...
The current year financial statements for Blue Water Company and Prime Fish Company are presented below....
 The current year financial statements for Blue Water Company and Prime Fish Company are presented below. Blue Water Prime Fish Balance sheet: Cash Accounts receivable (net) Inventory Property & equipment (net) Other assets Total assets Current liabilities Long-term debt (interest rate: 10%) Capital stock $10 par value) Additional paid-in capital Retained earnings Total liabilities and stockholders' equity Income statement: Sales revenue (1/3 on credit) Cost of goods sold Operating expenses Net income Other data: Per share stock price at end...
Hi need some help Calculating the Liquidity, solvency and profitability of Marriott Intercontinental with the Financial...
 Hi
need some help Calculating the Liquidity, solvency and
profitability of Marriott Intercontinental with the Financial
Statement of Year 2012. Please, I would appreciate a brief
description of how was calculated everything to understand the
exercise.
Liquidity Working capital Current ratio Current cash debt coverage Inventory turnover Days in inventory Accounts receivable turnover Average collection period Current assets-Current liabilities Current assets Current liabilities Net cash provided by operating activities Average current liabilities Cost of goods sold Average inventory 365 days...
Hi
need some help Calculating the Liquidity, solvency and
profitability of Marriott Intercontinental with the Financial
Statement of Year 2012. Please, I would appreciate a brief
description of how was calculated everything to understand the
exercise.
Liquidity Working capital Current ratio Current cash debt coverage Inventory turnover Days in inventory Accounts receivable turnover Average collection period Current assets-Current liabilities Current assets Current liabilities Net cash provided by operating activities Average current liabilities Cost of goods sold Average inventory 365 days...
The Coca-Cola Company and PepsiCo, Inc. provide refreshments to every corner of the world. Suppose selected...
 The Coca-Cola Company and PepsiCo,
Inc. provide refreshments to every corner of the world.
Suppose selected data from recent consolidated financial statements
for The Coca-Cola Company and for PepsiCo, Inc. are presented here
(in millions).
Coca-Cola
PepsiCo
Total current assets
$17,551
$12,571
Total current liabilities
13,721
8,756
Net sales
30,990
43,232
Cost of goods sold
11,088
20,099
Net income
6,824
5,946
Average (net) accounts receivable for the year
3,424
4,654
Average inventories for the year
2,271
2,570
Average total assets...
The Coca-Cola Company and PepsiCo,
Inc. provide refreshments to every corner of the world.
Suppose selected data from recent consolidated financial statements
for The Coca-Cola Company and for PepsiCo, Inc. are presented here
(in millions).
Coca-Cola
PepsiCo
Total current assets
$17,551
$12,571
Total current liabilities
13,721
8,756
Net sales
30,990
43,232
Cost of goods sold
11,088
20,099
Net income
6,824
5,946
Average (net) accounts receivable for the year
3,424
4,654
Average inventories for the year
2,271
2,570
Average total assets...
Statement of the Assignment: Please prepare a comprehensive list of financial ratios as introduced in Chapter...
Statement of the Assignment: Please prepare a comprehensive list of financial ratios as introduced in Chapter 3 of the textbook. Write a brief explanation below each financial ratio, e.g. what does the financial ratio measures or what the significance of it is. For example: Current Ratio = Current Assist / Current Liabilities Current ratio measures whether our current assets, if liquidated, are sufficient to pay all of our current liabilities. A CR of 1.5, for example, shows that if we...
2021 was 50,000. Compute selected ratios, and compare liquidity, profitability, and solvency for two companies P15...
 2021 was 50,000. Compute selected ratios, and compare liquidity, profitability, and solvency for two companies P15.5 (LO 2) Selected financial data of Target (USA) and Wal-Mart Stores, Inc. (USA) for a recent year are presented below (in millions). Wal-Mart Target Stores, Inc. Corporation Income Statement Data for Year $476,294 358,069 91,353 $72,596 51,160 Net sales Cost of goods sold 16,816 Selling and administrative expenses Interest expense Other income (expense) Income tax expense 2,335 1,126 (410) 8,105 (391) 1,132 $ 16,022...
14.5A part a (#1-11) and part b please and thank you P14.5A (LO 3) Writing Suppose...
 14.5A part a (#1-11) and part b please and thank you
P14.5A (LO 3) Writing Suppose selected financial data of Target and Wal-Mart for 2020 are presented here (in millions). Compute selected ratios, and compare liquidity, profitability, and solvency for two companies. Net sales Cost of goods sold Selling and administrative expenses Interest expense Other income (expense) Income tax expense Net income Target Wal-Mart Corporation Stores, Inc. Income Statement Data for Year $65,357 $408,214 45,583 304,657 15,101 79,607 707 2,065...
14.5A part a (#1-11) and part b please and thank you
P14.5A (LO 3) Writing Suppose selected financial data of Target and Wal-Mart for 2020 are presented here (in millions). Compute selected ratios, and compare liquidity, profitability, and solvency for two companies. Net sales Cost of goods sold Selling and administrative expenses Interest expense Other income (expense) Income tax expense Net income Target Wal-Mart Corporation Stores, Inc. Income Statement Data for Year $65,357 $408,214 45,583 304,657 15,101 79,607 707 2,065...
 The current year financial statements for Blue Water Company and Prime Fish Company are presented below. Blue Water Prime Fish Balance sheet: Cash Accounts receivable (net) Inventory Property &equipment (net) Other assets Total assets Current liabilities Long-term debt (interest rate: 15%) Capital stock ($10 par value) Additional paid-in capital Retained earnings Total liabilities and stockholders' equity Income statement: Sales revenue (1/2 on credit) Cost of goods sold Operating expenses Net income Other data: Per share stock price at end of...
 I need answer for B
80 2 A Further Look at Financial Statements (a) Comment on the relative profitability of the companies by computing the net income (b) Comment on the relative liquidity of the companies by computing working capital and (c) Comment on the relative solvency of the companies by computing the debt to assets and earnings per share for each company for 2017 the current ratio for each c ratio and the free cash flow for each company...
I need answer for B
80 2 A Further Look at Financial Statements (a) Comment on the relative profitability of the companies by computing the net income (b) Comment on the relative liquidity of the companies by computing working capital and (c) Comment on the relative solvency of the companies by computing the debt to assets and earnings per share for each company for 2017 the current ratio for each c ratio and the free cash flow for each company...
 The current year financial statements for Blue Water Company and Prime Fish Company are presented below. Blue Water Prime Fish Balance sheet: Cash Accounts receivable (net) Inventory Property & equipment (net) Other assets Total assets 21,000 31,000 40,000 401,000 305,000 $ 798,000 49,000 60,000 512,000 106,000 71,000 $ 798,000 $ 41,000 38,000 99,000 140,000 84,000 $ 402,000 99,000 65,000 148,000 29,000 61,000 $ 402,000 $ Current liabilities $ Long-term debt (interest rate: 10%) Capital stock ($10 par value) Additional paid-in...
 The current year financial statements for Blue Water Company and Prime Fish Company are presented below. Blue Water Prime Fish Balance sheet: Cash Accounts receivable (net) Inventory Property & equipment (net) Other assets Total assets Current liabilities Long-term debt (interest rate: 10%) Capital stock $10 par value) Additional paid-in capital Retained earnings Total liabilities and stockholders' equity Income statement: Sales revenue (1/3 on credit) Cost of goods sold Operating expenses Net income Other data: Per share stock price at end...
 Hi
need some help Calculating the Liquidity, solvency and
profitability of Marriott Intercontinental with the Financial
Statement of Year 2012. Please, I would appreciate a brief
description of how was calculated everything to understand the
exercise.
Liquidity Working capital Current ratio Current cash debt coverage Inventory turnover Days in inventory Accounts receivable turnover Average collection period Current assets-Current liabilities Current assets Current liabilities Net cash provided by operating activities Average current liabilities Cost of goods sold Average inventory 365 days...
Hi
need some help Calculating the Liquidity, solvency and
profitability of Marriott Intercontinental with the Financial
Statement of Year 2012. Please, I would appreciate a brief
description of how was calculated everything to understand the
exercise.
Liquidity Working capital Current ratio Current cash debt coverage Inventory turnover Days in inventory Accounts receivable turnover Average collection period Current assets-Current liabilities Current assets Current liabilities Net cash provided by operating activities Average current liabilities Cost of goods sold Average inventory 365 days...
 The Coca-Cola Company and PepsiCo,
Inc. provide refreshments to every corner of the world.
Suppose selected data from recent consolidated financial statements
for The Coca-Cola Company and for PepsiCo, Inc. are presented here
(in millions).
Coca-Cola
PepsiCo
Total current assets
$17,551
$12,571
Total current liabilities
13,721
8,756
Net sales
30,990
43,232
Cost of goods sold
11,088
20,099
Net income
6,824
5,946
Average (net) accounts receivable for the year
3,424
4,654
Average inventories for the year
2,271
2,570
Average total assets...
The Coca-Cola Company and PepsiCo,
Inc. provide refreshments to every corner of the world.
Suppose selected data from recent consolidated financial statements
for The Coca-Cola Company and for PepsiCo, Inc. are presented here
(in millions).
Coca-Cola
PepsiCo
Total current assets
$17,551
$12,571
Total current liabilities
13,721
8,756
Net sales
30,990
43,232
Cost of goods sold
11,088
20,099
Net income
6,824
5,946
Average (net) accounts receivable for the year
3,424
4,654
Average inventories for the year
2,271
2,570
Average total assets...
 2021 was 50,000. Compute selected ratios, and compare liquidity, profitability, and solvency for two companies P15.5 (LO 2) Selected financial data of Target (USA) and Wal-Mart Stores, Inc. (USA) for a recent year are presented below (in millions). Wal-Mart Target Stores, Inc. Corporation Income Statement Data for Year $476,294 358,069 91,353 $72,596 51,160 Net sales Cost of goods sold 16,816 Selling and administrative expenses Interest expense Other income (expense) Income tax expense 2,335 1,126 (410) 8,105 (391) 1,132 $ 16,022...
 14.5A part a (#1-11) and part b please and thank you
P14.5A (LO 3) Writing Suppose selected financial data of Target and Wal-Mart for 2020 are presented here (in millions). Compute selected ratios, and compare liquidity, profitability, and solvency for two companies. Net sales Cost of goods sold Selling and administrative expenses Interest expense Other income (expense) Income tax expense Net income Target Wal-Mart Corporation Stores, Inc. Income Statement Data for Year $65,357 $408,214 45,583 304,657 15,101 79,607 707 2,065...
14.5A part a (#1-11) and part b please and thank you
P14.5A (LO 3) Writing Suppose selected financial data of Target and Wal-Mart for 2020 are presented here (in millions). Compute selected ratios, and compare liquidity, profitability, and solvency for two companies. Net sales Cost of goods sold Selling and administrative expenses Interest expense Other income (expense) Income tax expense Net income Target Wal-Mart Corporation Stores, Inc. Income Statement Data for Year $65,357 $408,214 45,583 304,657 15,101 79,607 707 2,065...
Most questions answered within 3 hours.
-
Product J is one of the many products manufactured and sold by
Gooble Company. An income...
asked 2 minutes ago -
Balance the following redox reaction that occurs in H2O2 ---->
H2O + O2
(please show the...
asked 3 minutes ago -
What is the “boreal forest”, and why does it occur where it does
(in broad terms)?
asked 4 minutes ago -
a
62 kg sprinter, started from resr, runs 47 m in 7 s at a constant...
asked 21 minutes ago -
For python 3.7. This should only be a few lines if any, but for
some reason...
asked 31 minutes ago -
what is IoT? How is it being used today? How will it be used in
the...
asked 45 minutes ago -
Please answer the four questions below.
1. If you were going to test a method that...
asked 1 hour ago -
Provide two or three examples of support he uses to reinforce
his arguments?
The Alienation of...
asked 1 hour ago -
QUESTION 1
Why do we see terms with multiple names in the database
community?
Consistency is...
asked 1 hour ago -
In a titration experiment, 11.5 mL of 0.400 M H2SO4 neutralized
48.0 mL of NaOH. What...
asked 1 hour ago -
A shot-putter throws the shot with a horizontal velocity of 10
m/s and a
vertical velocity...
asked 1 hour ago -
Mildred sells industrial-sized refrigeration units. Her
prospective buyer's face looks tense, and his forehead is wrinkled....
asked 1 hour ago