
Homework Answers
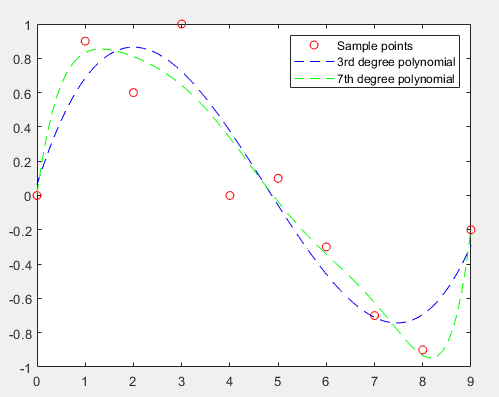
Given the data points (xs,ys), we plot the curve at the data points in x using Matlab code below:
Required Matlab code with explanatory comments is below:

ys=[0 0.9 0.6 1 0 0.1 -0.3 -0.7 -0.9 -0.2]; %y sample
points
xs=0:length(ys)-1; %x sample points
x=0:0.1:length(ys)-1; %x data points
p3=polyfit(xs,ys,3); %fit third degree polynomial to (xs,ys)
p7=polyfit(xs,ys,7); %fit seventh degree polynomial to
(xs,ys)
plot(xs,ys,'ro'); %plot sample points as red dots
hold on
plot(x,polyval(p3,x),'b--'); %plot as blue dashed lines
plot(x,polyval(p4,x),'g--'); %plot as green double dashed
lines
legend('Sample points','3rd degree polynomial', '7th degree
polynomial', 'Location', 'NorthEast') %add a legend

Resulting plot is below:

Please do rate this answer positively if you found it helpful. Thanks and have a good day!
Add Answer to:
matlap 3, Programmi ng Polynomial interpolation has been known sample points are plotted ys different ways...
Most questions answered within 3 hours.
-
What are the three mechanisms that control hormone release and a
example of each.
asked 12 minutes ago -
What would happen to the price level and real GDP if new, large
reserves of petroleum...
asked 14 minutes ago -
2. According to economists, people pollute because
a. They have low self esteem
b. They are...
asked 7 minutes ago -
For this project you will be writing up a simple Clock program
to keep track of...
asked 14 minutes ago -
The December 31, 2018, adjusted trial balance for Fightin' Blue
Hens Corporation is presented below.
...
asked 18 minutes ago -
E21-11 (L02) (Amortization Schedule and Journal Entries for
Lessee) Laura Leasing Company signs an agreement on...
asked 36 minutes ago -
Joe Mataya’s company provides after-sales support for all the
photo-copiers and high-load printers on our campus....
asked 44 minutes ago -
In a statistics class there are 12 students. Five of the
students are seniors and the...
asked 1 hour ago -
can someone please explain for me in any easy way what does
Dipole mean ?
asked 1 hour ago -
Consider the following grammar:
<S> → <A> a <B> b
<A> → <A> b | b...
asked 1 hour ago -
Chapter’s 2 “Dominos Sizzles with Pizza Tracker” Case Study.
Ansewer the following questions:
1) What kinds...
asked 1 hour ago -
It's a snowy day and you're pulling a friend along a level road
on a sled....
asked 1 hour ago