
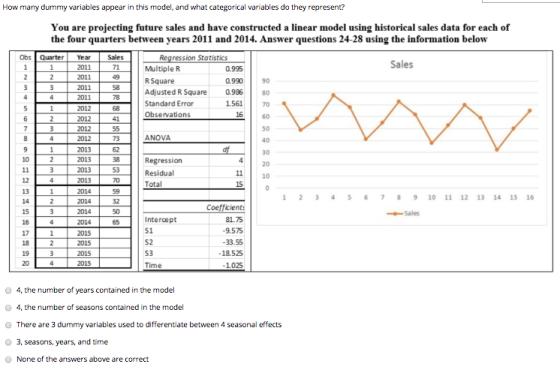
How many dummy variables appear in this model, and what categorical variables do they represent? You are projecting future sales and have constructed a linear model using historical sales data for each of the four quarters between years 2011 and 2014. Answer questions 24-28 using the information below Regression Statisties Multiple R Obs Quarter Year Sales Sales 1 2011 71 0.995 2011 49 R Square 0.990 90 2011 58 Adjusted R Square 0.986 80 4 4 2011 78 Standard Error 1561 70 2012 68 5 1 Observations 16 60 2012 41 7 2012 55 50 ANOVA 8 4 2012 73 40 df 2013 62 30 10 2013 38 Regression 4 20 11 2013 53 Residual 11 10 12 4 2013 70 Total 15 C 2014 13 1 59 7 8 9 10 11 12 13 14 15 16 14 2014 32 Coefficient 15 2014 50 Sales Intercept 81.75 4 16 2014 65 S1 -9.575 17 1 2015 S2 -33.55 18 2015 19 2015 S3 -18.525 20 2015 Time -1.025 4, the number of years contained in the model 4, the number of seasons contained in the model There are 3 dummy variables used to differentiate between 4 seasonal effects 3, seasons, years, and time None of the answers above are correct
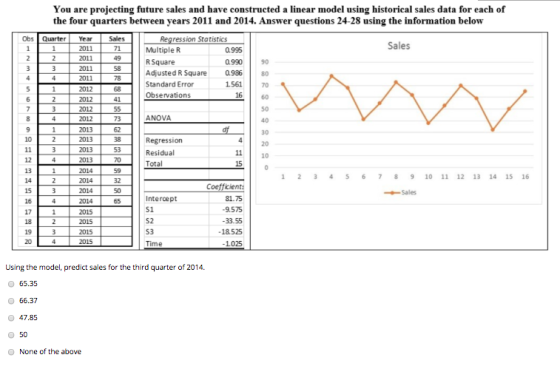
You are projecting future sales and have constructed a linear model using historical sales data for each of the four quarters between years 2011 and 2014. Answer questions 24-28 using the information below Regression Statistics Multiple R Obs Quarter Year Sales Sales 1 1 2011 71 0.995 2 2011 49 R Square 0.990 90 3 3 2011 58 Adjusted R Square 0.986 80 4 2011 78 Standard Error 1.561 70 5 1 2012 68 Observations 16 60 2 2012 41 7 3 2012 55 50 ANOVA 8 4 2012 73 40 df 9 2013 62 30 10 2 2013 38 Regression Residual 4 20 11 3 2013 53 11 10 2013 12 4 70 Total 15 0 1 13 2014 59 6 7 8 11 12 13 16 9 10 14 15 14 2014 32 Coefficient 15 3 2014 50 Sales Intercept 81.75 16 2014 65 S1 9.575 17 1 2015 S2 -33.55 18 2015 19 2015 S3 -18.525 20 4 2015 Time 1.025 Using the model, predict sales for the third quarter of 2014. 65.35 66.37 47.85 50 None of the above Nm no
Homework Answers
(first part) right choice is 9.
here number of observations=n=12
period of moving average=k=3
required answer=n-k=12-3=9
(second part) right choice is. There are 3 dummy variables used to differentiate between 4 seasons effect
(Third part) right choice is 47.85
the model is y^= 81.75-9.575*S1-33.55*S218.525*S3+1.025*Time
for year 2014 and Quarter 3 the
time would be =15 and S1=0, S2=0 and S3=1
y^=81.75-18.525+15*1.025=47.85
answer is 47.85
Add Answer to:
Assume you are analyzing a time series of 12 observations. Using a 3-period moving average, you...
You are projecting future sales and have constructed a linear model using historical sales data for...
 You are projecting future sales and have constructed a linear model using historical sales data for each of the four quarters between years 2011 and 2014. Answer questions 24-28 using the information below Regression Statistics Multiple R Obs Quarter Year Sales Sales 1 1 2011 71 0.995 2 2 2011 49 R Square 0.990 90 3 3 2011 58 Adjusted R Square 0.986 80 4 4 2011 78 Standard Error 1561 70 1 2012 68 Observations 16 60 6 2...
Using the model, predict sales for the fourth quarter of year 2015 You are projecting future...
 Using the model, predict sales for the fourth quarter of year 2015 You are projecting future sales and have constructed a linear model using historical sales data for each of the four quarters between years 2011 and 2014. Answer questions 24-28 using the information below Regression Statistics Obs Quarter Year Sales Sales 1 2011 71 Multiple R 0.995 7 2011 49 R Square 0.990 90 58 3 2011 Adjusted R Square 0.986 80 4 2011 78 Standard Error 1.561 70...
You purchased 100 shares of McDonald's Corp. common stock on 04/01/2009 for $57.49 per share. On...
You purchased 100 shares of McDonald's Corp. common stock on 04/01/2009 for $57.49 per share. On December 29, 2017 you sold the 100 shares for $172.12 per share. Dividend payment dates and amounts per share for the period of time you owned the stock are shown below. PLEASE SHOW EXCEL FUNCTIONS/FORMULAS (A) Calculate your annual rate of return on this investment. (B) Calculate your annual rate of return without including the dividends in the calculation. You will need to use...
Using the data in the following table, 2. estimate the: a. Average return and volatility for...
Using the data in the following table, 2. estimate the: a. Average return and volatility for each stock. b. Covariance between the stocks. c. Correlation between these two stocks, a. Estimate the average return and volatility for each stock. The average return of stock A is _______ %. (Round to two decimal places.)Year201020112012201320142015Stock A-3%16%7%-3%4%6%Stock B16%19%28%-1%-11%25%
Using Excel, how could I display the total number of responses to each level of the...
Using Excel, how could I display the total number of responses to each level of the survey scale across all regions for each year and, more specifically, what formula would I use? Is it SUMif? Survey Scale: 0 1 2 3 4 5 Sample North America Size 2010 1 0 2 14 22 11 50 2011 0 0 2 14 20 14 50 2012 1 1 1 8 34 15 60 2013 1 2 6 12 34 45 100 2014...
You are an analyst fir a mutual fund that wanrs to include a home inprovement store...
 You
are an analyst fir a mutual fund that wanrs to include a home
inprovement store in its portfolio. Given that Home Depot and Lowes
are the dominant olayers in the industry, which firm would you
recommend buying? Explain
C D F N M N O P Q R 5 T 1 LOWE's HOME DEPOT 2010-01 2001-01 2012-01 2011-01 2014-01 2005-2006-01 2017-01 220 48.835 50,208 50 52 54 56.223 52 2010-2011-01 2012-01 2013-08 2014-01 2015-2016-01 2017-01 3.112 3.560 277 73...
You
are an analyst fir a mutual fund that wanrs to include a home
inprovement store in its portfolio. Given that Home Depot and Lowes
are the dominant olayers in the industry, which firm would you
recommend buying? Explain
C D F N M N O P Q R 5 T 1 LOWE's HOME DEPOT 2010-01 2001-01 2012-01 2011-01 2014-01 2005-2006-01 2017-01 220 48.835 50,208 50 52 54 56.223 52 2010-2011-01 2012-01 2013-08 2014-01 2015-2016-01 2017-01 3.112 3.560 277 73...
2) Student Population Data From Western Carolina University Number Year Enrolled 1 2006 8,860 2...
2) Student Population Data From Western Carolina University Number Year Enrolled 1 2006 8,860 2 2007 9,056 3 2008 9,050 4 2009 9,429 5 2010 9,407 6 2011 9,352 7 2012 9,608 8 2013 10,107 9 2014 10,382 10 2015 10,340 11 2016 10,805 12 2017 11,034 13 2018 11,639 3) What is the correlation between year and student population? 4) What is the regression model for...
PLEASE SHOW FORMULAS IN EXCEL Case: Performance Lawn Equipment PLE sells small tractors worldwide...
PLEASE SHOW FORMULAS IN EXCEL Case: Performance Lawn Equipment PLE sells small tractors worldwide, with sales regions including North America, South America, Europe, and the Pacific Rim. Three years ago a new region was opened to serve China, where a booming market for small tractors has been established. PLE has always emphasized quality and considers the quality it builds into its products as its primary selling point. In the past 2 years, PLE has also emphasized the ease of use...
Please solve this question I want to solve this question on the attached tables Analyzing a...
 Please solve this question
I want to solve this question on the attached
tables
Analyzing a company for Its Investment Potential In its annual report, WRS Athletic Supply, Inc., includes the following five-year financial summary. WRS ATHLETIC SUPPLY, INC. Five-Year Financial Summary (Partial; adapted) 2010 2015 5244,524 2011 5137634 17% 2014 2013 2012 5217799 $191,329 5165,013 16% 20% 6% 5% 1,873 1,787 1,615 171,562 150,255 129,664 9% 2,001 191,838 1.191 108,725 41,236 36,356 31.679 27.408 22,516 1,383 (188) 1,063 (138)...
Please solve this question
I want to solve this question on the attached
tables
Analyzing a company for Its Investment Potential In its annual report, WRS Athletic Supply, Inc., includes the following five-year financial summary. WRS ATHLETIC SUPPLY, INC. Five-Year Financial Summary (Partial; adapted) 2010 2015 5244,524 2011 5137634 17% 2014 2013 2012 5217799 $191,329 5165,013 16% 20% 6% 5% 1,873 1,787 1,615 171,562 150,255 129,664 9% 2,001 191,838 1.191 108,725 41,236 36,356 31.679 27.408 22,516 1,383 (188) 1,063 (138)...
Quarter Year 2008 sales 1 2 3 4 160 180 190 70 Quarter Year 2009 sales...
 Quarter Year 2008 sales 1 2 3 4 160 180 190 70 Quarter Year 2009 sales 200 210 260 230 Quarter Year 2009 sales 210 240 290 260 what is the seasonal factor for the quarter2 Of 2011? O A. 0.945 O B. 1.1 ° C. 0.867 OD. 0.975 The following data show the quarterly sales of a major auto manufacturer for the years 2012 through 2014. Quarter year 2012 sales 12 34 500 380 290 170 Quarter year 2013...
 You are projecting future sales and have constructed a linear model using historical sales data for each of the four quarters between years 2011 and 2014. Answer questions 24-28 using the information below Regression Statistics Multiple R Obs Quarter Year Sales Sales 1 1 2011 71 0.995 2 2 2011 49 R Square 0.990 90 3 3 2011 58 Adjusted R Square 0.986 80 4 4 2011 78 Standard Error 1561 70 1 2012 68 Observations 16 60 6 2...
 Using the model, predict sales for the fourth quarter of year 2015 You are projecting future sales and have constructed a linear model using historical sales data for each of the four quarters between years 2011 and 2014. Answer questions 24-28 using the information below Regression Statistics Obs Quarter Year Sales Sales 1 2011 71 Multiple R 0.995 7 2011 49 R Square 0.990 90 58 3 2011 Adjusted R Square 0.986 80 4 2011 78 Standard Error 1.561 70...
 You
are an analyst fir a mutual fund that wanrs to include a home
inprovement store in its portfolio. Given that Home Depot and Lowes
are the dominant olayers in the industry, which firm would you
recommend buying? Explain
C D F N M N O P Q R 5 T 1 LOWE's HOME DEPOT 2010-01 2001-01 2012-01 2011-01 2014-01 2005-2006-01 2017-01 220 48.835 50,208 50 52 54 56.223 52 2010-2011-01 2012-01 2013-08 2014-01 2015-2016-01 2017-01 3.112 3.560 277 73...
You
are an analyst fir a mutual fund that wanrs to include a home
inprovement store in its portfolio. Given that Home Depot and Lowes
are the dominant olayers in the industry, which firm would you
recommend buying? Explain
C D F N M N O P Q R 5 T 1 LOWE's HOME DEPOT 2010-01 2001-01 2012-01 2011-01 2014-01 2005-2006-01 2017-01 220 48.835 50,208 50 52 54 56.223 52 2010-2011-01 2012-01 2013-08 2014-01 2015-2016-01 2017-01 3.112 3.560 277 73...
 Please solve this question
I want to solve this question on the attached
tables
Analyzing a company for Its Investment Potential In its annual report, WRS Athletic Supply, Inc., includes the following five-year financial summary. WRS ATHLETIC SUPPLY, INC. Five-Year Financial Summary (Partial; adapted) 2010 2015 5244,524 2011 5137634 17% 2014 2013 2012 5217799 $191,329 5165,013 16% 20% 6% 5% 1,873 1,787 1,615 171,562 150,255 129,664 9% 2,001 191,838 1.191 108,725 41,236 36,356 31.679 27.408 22,516 1,383 (188) 1,063 (138)...
Please solve this question
I want to solve this question on the attached
tables
Analyzing a company for Its Investment Potential In its annual report, WRS Athletic Supply, Inc., includes the following five-year financial summary. WRS ATHLETIC SUPPLY, INC. Five-Year Financial Summary (Partial; adapted) 2010 2015 5244,524 2011 5137634 17% 2014 2013 2012 5217799 $191,329 5165,013 16% 20% 6% 5% 1,873 1,787 1,615 171,562 150,255 129,664 9% 2,001 191,838 1.191 108,725 41,236 36,356 31.679 27.408 22,516 1,383 (188) 1,063 (138)...
 Quarter Year 2008 sales 1 2 3 4 160 180 190 70 Quarter Year 2009 sales 200 210 260 230 Quarter Year 2009 sales 210 240 290 260 what is the seasonal factor for the quarter2 Of 2011? O A. 0.945 O B. 1.1 ° C. 0.867 OD. 0.975 The following data show the quarterly sales of a major auto manufacturer for the years 2012 through 2014. Quarter year 2012 sales 12 34 500 380 290 170 Quarter year 2013...
Most questions answered within 3 hours.
-
The cable supporting a 2145-kg elevator has a maximum strength
of 2.18×10⁴ N.
a) What maximum...
asked 2 minutes ago -
Find the critical value(s) and rejection region(s) for a
two-tailed chi-square test with a sample size...
asked 6 minutes ago -
One of your experts gave me an answer of $7.36 but there are
many different answers...
asked 12 minutes ago -
Petrus Framing's cost formula for its supplies cost is $1,790
per month plus $10 per frame....
asked 25 minutes ago -
Introduction
Information design is a field that studies the way information
should be displayed, which is...
asked 22 minutes ago -
1.The main product of the reaction between p-cresol and Br2 /
FeBr3 is:
3-Bromo-4-methyl phenol
2-Bromo-4-methyl...
asked 26 minutes ago -
At present, concentration
of 92235U in naturally
occurring uranium deposits is approximately 0.74 %. What will the...
asked 29 minutes ago -
Question 1:
For the following reaction, 8.72 grams of nitrogen gas are
allowed to react with...
asked 32 minutes ago -
Discuss the benefits and detriments of hard water, and your
opinion on using water softeners.
asked 1 hour ago -
For a Friedel-Crafts alkylation reaction between
1,4-dimethoxybenzene with 3-methyl-2-butanol and sulfuric acid what
product was formed...
asked 47 minutes ago -
This programming assignment needs to be written so that it can
do infix expression to postfix...
asked 53 minutes ago -
Below are the reduction half reactions for chemolithoautotrophic
denitrification, where hydrogen is a source of electrons...
asked 53 minutes ago