

Homework Answers
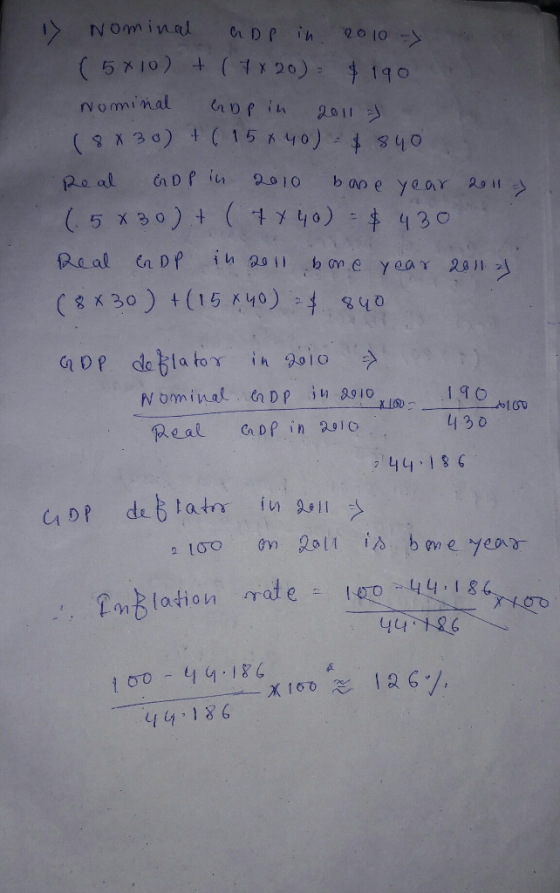
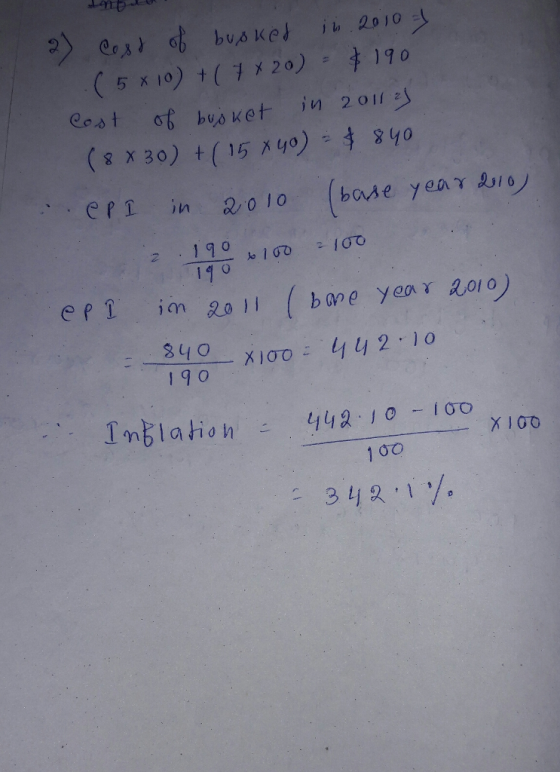
Gdp deflator=(nominal GDP/real GDP)*100. CPI=(cost of the basket in the current year/cost of the basket in base year)*100
Add Answer to:
Suppose the following economy produced pencils and erasers in 2011 and 2012 according to the following...
Suppose the following economy produced pencils and erasers in 2011 and 2012 according to the following...
 Suppose the following economy produced pencils and erasers in 2011 and 2012 according to the following table. CPl basket in this economy consists of 5 pencils and 7 erasers. Which one is the value nearest to an inflation rate by CPI between 2010 and 2011 using 2010 as a base year? Q2010 P2010 02011 P2011 Pencils 5 10 8 30 Erasers 7 20 15 40 Select one: a. 135 O b. 100 O c. 115 d. 125
Suppose the following economy produced pencils and erasers in 2010 and 2011 according to the following...
 Suppose the following economy produced pencils and erasers in 2010 and 2011 according to the following table. CPI basket in this economy consists of 5 pencils and 7 erasers. Which one is the value nearest to an inflation rate by CPI between 2010 and 2011 using 2010 as a base year? 2010 2010 2011 2011 Pencils 5 10 8 30 Erasers 7 20 15 40 Select one a. 135 b. 115 С. 125 d. 100 Suppose the following economy produced...
How do you solve these GDP questions? Question 8 Not yet answed erasers. Which one is...
 How do you solve these GDP questions?
Question 8 Not yet answed erasers. Which one is the value nearest to an inflation rate by CPI between 2010 and 2011 using 2010 as a base year? Points out of 1.00 P Flag question Suppose the following economy produced pencils and erasers in 2010 and 2011 according to the following table. CPI basket in this economy consists of 5 pencils and 7 2010 P20102011 P2011 Pencils 5 10 8 30 Erasers 7...
How do you solve these GDP questions?
Question 8 Not yet answed erasers. Which one is the value nearest to an inflation rate by CPI between 2010 and 2011 using 2010 as a base year? Points out of 1.00 P Flag question Suppose the following economy produced pencils and erasers in 2010 and 2011 according to the following table. CPI basket in this economy consists of 5 pencils and 7 2010 P20102011 P2011 Pencils 5 10 8 30 Erasers 7...
5. Real versus nominal GDP Consider a simple economy that produces two goods: pencils and erasers....
 5. Real versus nominal GDP Consider a simple economy that produces two goods: pencils and erasers. The following table shows the prices and quantities of the goods over a three-year period. Pencils Price Quantity (Dollars per pencil (Number of pencils) 1 125 Erasers Price Quantity (Dollars per eraser (Number of erasers) 1 200 Year 2018 2019 170 4 230 2020 4 150 4 170 Use the information from the preceding table to fill in the following table. Nominal GDP (Dollars)...
19. (16 POINTS) Suppose that the representative basket of goods consumed in the economy in a...
 19. (16 POINTS) Suppose that the representative basket of goods consumed in the economy in a year is made of: 150 lbs of bread, 80 bottles of water and 50 T-shirts. Prices (in USD) of each of these items, across different years, are reported in the following table Year 1 lbs of bread 1 bottle of water 1 T-shirt 2008 S2 2009 $2.3 2010 $2.6 2011 $2.8 2012 S3 $1.2 $1.2 $1.35 $1.8 $1.8 $15 $18 $18 $18 $25 (a)...
Assume that an economy produces only three goods; Computers, cars, and pizza. Table 1 gives the price and quantity for each good and the number of employed and unemployed individuals for the years 2010-2013. Table 2 gives the fixed basket used for calcula
 Assume that an economy produces
only three goods; Computers, cars, and pizza. Table 1 gives the price
and quantity for each good and the number of employed and unemployed
individuals for the years 2010-2013. Table 2 gives the fixed basket used
for calculating the CPI. Assume that the base year is 2011 and show
your work! Table 1 - Price and Quantity of Goods Sold in 2010-2013 2010
2011 2012 2013 P Q P O P Q 25 Computers Cars...
Assume that an economy produces
only three goods; Computers, cars, and pizza. Table 1 gives the price
and quantity for each good and the number of employed and unemployed
individuals for the years 2010-2013. Table 2 gives the fixed basket used
for calculating the CPI. Assume that the base year is 2011 and show
your work! Table 1 - Price and Quantity of Goods Sold in 2010-2013 2010
2011 2012 2013 P Q P O P Q 25 Computers Cars...
2010 Prices 2011 Prices 2012 Prices Milk $2 $3 $4 Cookies $2 $3 $2 CPI A. For...
2010 Prices 2011 Prices 2012 Prices Milk $2 $3 $4 Cookies $2 $3 $2 CPI A. For a fixed basket of 5 glasses of milk and 10 cookies, and using the prices in the table, calculate the CPI in each year for this economy. 2010 is your base year. B. If the CPI in 2013 was 192 and the CPI in 2014 was 200, what would the inflation rate be? What would the inflation rate mean? C. If you earned $10/hour in 2010...
5. Inflation and CPI Suppose in Economy A, the final goods produced in year 2015, 2016...
 5. Inflation and CPI Suppose in Economy A, the final goods produced in year 2015, 2016 and 2017 are milk, beef, gasoline, cloth. The quantities (Q) produced and prices (P) are given by the following: Year 2015 Qmilk Pmilk 200 2.35 220 2.49 233 2.79 (beer Pbeer lgasolin 120 3.30 400 123 3.35 430 145 3.47 440 Pgasoline (cloth Pcloth 1.12 510 2.33 1.15 512 2.47 1.20 523 2.67 2016 2017 Let 2015 be the base year and assume the...
please include detailed steps with answers 2. The table below shows the market basket of a...
 please include detailed steps with answers
2. The table below shows the market basket of a hypothetical economy is given below. Item Cost in 2011 Cost in 2010 $500 $120 Rent, 2 BR apartment 60 Hamburgers $630 $150 10 Movie tickets $60 $70 Total expenditure $680 $850 CPI (Base = 2010) a. Complete the table. b. Calculate the inflation rate between 2010 and 2011. c. Suppose the CPI in 2012 is 150. Provide an interpretation for the value. d. Calculate...
please include detailed steps with answers
2. The table below shows the market basket of a hypothetical economy is given below. Item Cost in 2011 Cost in 2010 $500 $120 Rent, 2 BR apartment 60 Hamburgers $630 $150 10 Movie tickets $60 $70 Total expenditure $680 $850 CPI (Base = 2010) a. Complete the table. b. Calculate the inflation rate between 2010 and 2011. c. Suppose the CPI in 2012 is 150. Provide an interpretation for the value. d. Calculate...
1. Suppose there are only 3 different goods produced and consumed in a closed economy. The...
 1. Suppose there are only 3 different goods produced and consumed in a closed economy. The following table shows the prices and quantities of each good consumed in 2002, 2003, 2004, and 2005. Price of a Quantity of Price Price of Quantity pair of a pair of of Quantity Year Apple of Apple shoes Breed of Breed 3001000 1500 shoes 2002 2003 500 600 15 100 1200 2004 80020 3501300 2005 900 25 500 Calculate nominal GDP in each of...
 Suppose the following economy produced pencils and erasers in 2011 and 2012 according to the following table. CPl basket in this economy consists of 5 pencils and 7 erasers. Which one is the value nearest to an inflation rate by CPI between 2010 and 2011 using 2010 as a base year? Q2010 P2010 02011 P2011 Pencils 5 10 8 30 Erasers 7 20 15 40 Select one: a. 135 O b. 100 O c. 115 d. 125
 Suppose the following economy produced pencils and erasers in 2010 and 2011 according to the following table. CPI basket in this economy consists of 5 pencils and 7 erasers. Which one is the value nearest to an inflation rate by CPI between 2010 and 2011 using 2010 as a base year? 2010 2010 2011 2011 Pencils 5 10 8 30 Erasers 7 20 15 40 Select one a. 135 b. 115 С. 125 d. 100 Suppose the following economy produced...
 How do you solve these GDP questions?
Question 8 Not yet answed erasers. Which one is the value nearest to an inflation rate by CPI between 2010 and 2011 using 2010 as a base year? Points out of 1.00 P Flag question Suppose the following economy produced pencils and erasers in 2010 and 2011 according to the following table. CPI basket in this economy consists of 5 pencils and 7 2010 P20102011 P2011 Pencils 5 10 8 30 Erasers 7...
How do you solve these GDP questions?
Question 8 Not yet answed erasers. Which one is the value nearest to an inflation rate by CPI between 2010 and 2011 using 2010 as a base year? Points out of 1.00 P Flag question Suppose the following economy produced pencils and erasers in 2010 and 2011 according to the following table. CPI basket in this economy consists of 5 pencils and 7 2010 P20102011 P2011 Pencils 5 10 8 30 Erasers 7...
 5. Real versus nominal GDP Consider a simple economy that produces two goods: pencils and erasers. The following table shows the prices and quantities of the goods over a three-year period. Pencils Price Quantity (Dollars per pencil (Number of pencils) 1 125 Erasers Price Quantity (Dollars per eraser (Number of erasers) 1 200 Year 2018 2019 170 4 230 2020 4 150 4 170 Use the information from the preceding table to fill in the following table. Nominal GDP (Dollars)...
 19. (16 POINTS) Suppose that the representative basket of goods consumed in the economy in a year is made of: 150 lbs of bread, 80 bottles of water and 50 T-shirts. Prices (in USD) of each of these items, across different years, are reported in the following table Year 1 lbs of bread 1 bottle of water 1 T-shirt 2008 S2 2009 $2.3 2010 $2.6 2011 $2.8 2012 S3 $1.2 $1.2 $1.35 $1.8 $1.8 $15 $18 $18 $18 $25 (a)...
 5. Inflation and CPI Suppose in Economy A, the final goods produced in year 2015, 2016 and 2017 are milk, beef, gasoline, cloth. The quantities (Q) produced and prices (P) are given by the following: Year 2015 Qmilk Pmilk 200 2.35 220 2.49 233 2.79 (beer Pbeer lgasolin 120 3.30 400 123 3.35 430 145 3.47 440 Pgasoline (cloth Pcloth 1.12 510 2.33 1.15 512 2.47 1.20 523 2.67 2016 2017 Let 2015 be the base year and assume the...
 please include detailed steps with answers
2. The table below shows the market basket of a hypothetical economy is given below. Item Cost in 2011 Cost in 2010 $500 $120 Rent, 2 BR apartment 60 Hamburgers $630 $150 10 Movie tickets $60 $70 Total expenditure $680 $850 CPI (Base = 2010) a. Complete the table. b. Calculate the inflation rate between 2010 and 2011. c. Suppose the CPI in 2012 is 150. Provide an interpretation for the value. d. Calculate...
please include detailed steps with answers
2. The table below shows the market basket of a hypothetical economy is given below. Item Cost in 2011 Cost in 2010 $500 $120 Rent, 2 BR apartment 60 Hamburgers $630 $150 10 Movie tickets $60 $70 Total expenditure $680 $850 CPI (Base = 2010) a. Complete the table. b. Calculate the inflation rate between 2010 and 2011. c. Suppose the CPI in 2012 is 150. Provide an interpretation for the value. d. Calculate...
 1. Suppose there are only 3 different goods produced and consumed in a closed economy. The following table shows the prices and quantities of each good consumed in 2002, 2003, 2004, and 2005. Price of a Quantity of Price Price of Quantity pair of a pair of of Quantity Year Apple of Apple shoes Breed of Breed 3001000 1500 shoes 2002 2003 500 600 15 100 1200 2004 80020 3501300 2005 900 25 500 Calculate nominal GDP in each of...
Most questions answered within 3 hours.
-
HELP WITH SAS
Run the following DATA step to create a SAS data set called
ABC_CORP....
asked 5 minutes ago -
A researcher wishes to study the cumulative effects of several
combinations of HIV drugs. There are...
asked 25 minutes ago -
How
to make a simple game of whack a mole in pygame
asked 8 minutes ago -
Write a c/c++ program to read a list of students from a file and
create a...
asked 17 minutes ago -
Identify two different methods for collecting data in
qualitative research. What are the benefits and challenges...
asked 18 minutes ago -
I am suppose to have my array before the main class but I am
getting the...
asked 20 minutes ago -
Your task is to design the page table for the 32bit Pentium
microprocessor. Answer the following...
asked 26 minutes ago -
The Paradise Shoes Company has estimated its weekly TVC function
from data collected over the past...
asked 25 minutes ago -
Although Epicurus advocates pursuing pleasure for the
good life, discuss a few reasons why he does...
asked 42 minutes ago -
Problem 1: Present entries to record the selected transactions
described below:
(a)
Issued $2,790,000 of 5-year,...
asked 49 minutes ago -
Using technology to support HR activities increases:
a.
the efficiency of the administrative HR functions.
b....
asked 49 minutes ago -
1. List the features used to classify leaf
types.
2. List some characteristics that are shared...
asked 55 minutes ago