Use the relative frequency table shown to the right to calculate the number of the 600...
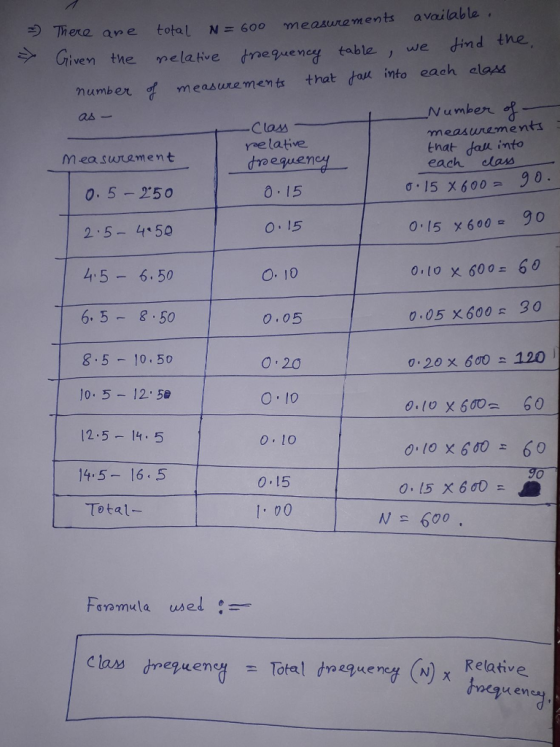
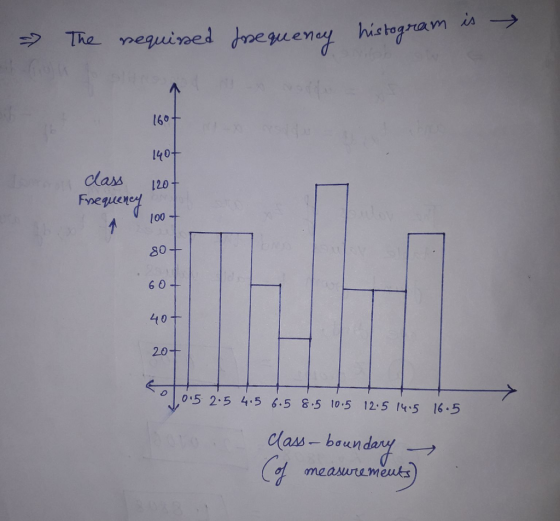
Use the relative frequency table shown to the right to calculate the number of the 600 measurements falling into each of the measurement classes. Then graph a frequency histogram for these data.
Measurement Class Relative Frequency
0.5-2.50 0.15
2.5-4.50 0.15
4.5-6.50 0.10
6.5-8.50 0.05
8.5-10.0 0.20
10.5-12.5 0.10
12.5-14.5 0.10
14.5-16.5 0.15
Graph
Calculate the number of measurements that fall into each class.
0.5-2.50 0.15
2.5-4.50 0.15
4.5-6.50 0.10
6.5-8.50 0.05
8.5-10.0 0.20
10.5-12.5 0.10
12.5-14.5 0.10
14.5-16.5 0.15
Graph
|
|
Homework Answers
TOPIC: Class frequency,Relative frequency and Histogram.
Add Answer to:
Use the relative frequency table shown to the right to calculate the number of the 600...
2.2.33 Question Help Use the relative frequency table shown to the right to calculate the number...
 2.2.33 Question Help Use the relative frequency table shown to the right to calculate the number of the 600 measurements falling into each of the measurement classes. Then graph a frequency histogram for these data Measurement Class 2.5-4.5 4.5-6.5 6.5-8.5 8.5-10.5 10.5-12.5 12.5-14.5 14.5-16.5 Relative Frequency 0.10 0.10 0.05 0.10 0.25 0.20 0.15 0.05 Calculate the number of measurements that fall into each class Measurement Class Frequen 0.5-2.5
Math shown is statistics 2.2 Graphical Methods for Describing Quantitative Data 1. Consider the stem-and-leaf display...
 Math shown is statistics
2.2 Graphical Methods for Describing Quantitative Data 1. Consider the stem-and-leaf display below, leaf unit-0.1 Stem Leaf 0 012 1 2248 2 1134599 3 00036 4 457 5 13 How many observations in the data set? How do you decide? yhe mwntbers a) b) Re-create all numbers, order them in descending order. c) Construct a dot plot. The following relative frequency table is for a data set of 300 observations. a) 2. Fill the frequency column...
Math shown is statistics
2.2 Graphical Methods for Describing Quantitative Data 1. Consider the stem-and-leaf display below, leaf unit-0.1 Stem Leaf 0 012 1 2248 2 1134599 3 00036 4 457 5 13 How many observations in the data set? How do you decide? yhe mwntbers a) b) Re-create all numbers, order them in descending order. c) Construct a dot plot. The following relative frequency table is for a data set of 300 observations. a) 2. Fill the frequency column...
Consider 500 measurements summarized in the accompanying frequency table Measurement 0.5-under 2.5 2.5-under 4.5 4.5-under 6.5...
 Consider 500 measurements summarized in the accompanying frequency table Measurement 0.5-under 2.5 2.5-under 4.5 4.5-under 6.5 6.5-under 8.5 8.5-under 10.5 10.5-under 12.5 12.5-under 14.5 14.5-under 16.5 Class Frequency 50 75 125 100 25 50 50 25 What is the mean for this sample data? 7.5 7.3 9.1 Consider the previous grouped sample data, what is the variance for this sample? 17.0 15.59 18.15 15.01
USE THE FOLLOWING FREQUENCY DISTRIBUTION FOR QUESTIONS 46-50. The following expanded frequency distribution was created from...
 USE THE FOLLOWING FREQUENCY DISTRIBUTION FOR QUESTIONS 46-50. The following expanded frequency distribution was created from a sample of size 25. Class Limits f Class Midpoint Class Boundaries Relative Frequency Cumulative Frequency 5-8 5 6.5 0.2 5 4.5-8.5 9-12 0.56 19 13-16 6 14.5 12.5-16.5 46) Find the missing frequency (frequency for the class 9-12). A) 10.5 B) 0.24 C) 25 D) 8.5-12.5 E) 14 47) Find the Cumulative Frequency for the class 13-16 A) 10.5 B) 0.24 C) 25...
The answers for both are given Answer for a) Answer for b) I need a detail...
 The answers for both are given
Answer for a)
Answer for b)
I need a detail explanation of how to find the
DENSITY histogram. Thanks
5.4.5 suppose the following sample of size of n process. 20 is obtained from an industrial 3.9 7.2 6.94.55.8 3.74.4 4.5 5.6 2.5 4.8 8.5 4.3 1.2 2.3 3.1 3.4 4.8 1.8 3.7 (a) Construct a density histogram for this data set using the intervals (1, 4.5], (4.5, 5.5] (5.5, 6.51(6.5, 10] (b) Construct a...
The answers for both are given
Answer for a)
Answer for b)
I need a detail explanation of how to find the
DENSITY histogram. Thanks
5.4.5 suppose the following sample of size of n process. 20 is obtained from an industrial 3.9 7.2 6.94.55.8 3.74.4 4.5 5.6 2.5 4.8 8.5 4.3 1.2 2.3 3.1 3.4 4.8 1.8 3.7 (a) Construct a density histogram for this data set using the intervals (1, 4.5], (4.5, 5.5] (5.5, 6.51(6.5, 10] (b) Construct a...
EXPLAIN Hου WE Ger THE CuASS AND CLASS UALUES FROm THE SAMPLE DATA2 OTHERS . ......
 EXPLAIN Hου WE Ger THE CuASS AND CLASS UALUES FROm THE SAMPLE DATA2 OTHERS . ... ANO A frequency table for the size of surface blemishes in mm on a sample of steel castings is shown below. Defect Size (mm 14 S8 912 1356 17-20 21-24 25-28 Frequency 18 25 10 2 We shall use this grouped data to determine the mode, meun and median for blemish size The middle value of each interval is taken as the cless value...
3. Based on the integration of the peaks, what is the relative number of protons which...
 3. Based on the integration of the peaks, what is the relative
number of protons which make up each signal?
4. Identify any common splitting patterns. (ie. Isopropyl,
ethyl, etc)
UN (43 MIL.) 10.02s, 1H), 7.716.J-2 Hz. ) 2.0 11.5 11.0 10.5 10.0 9.5 9.0 8.5 8.0 7.5 7.0 6.5 6.0 4.0 3.5 3.0 2.5 20 15 100.5 0.0 -0.5 -1.0 -1.5 -2. 5.5 5.0 4.5 fl (ppm)
3. Based on the integration of the peaks, what is the relative
number of protons which make up each signal?
4. Identify any common splitting patterns. (ie. Isopropyl,
ethyl, etc)
UN (43 MIL.) 10.02s, 1H), 7.716.J-2 Hz. ) 2.0 11.5 11.0 10.5 10.0 9.5 9.0 8.5 8.0 7.5 7.0 6.5 6.0 4.0 3.5 3.0 2.5 20 15 100.5 0.0 -0.5 -1.0 -1.5 -2. 5.5 5.0 4.5 fl (ppm)
I have to complete a lab report for a class using data collected and I have...
 I have to complete a lab report for a class using data collected
and I have no idea how to use this data. Please help!
Name Date REPORT SHEET Weak Acid vs. Strong Acid Titration EXPERIMENT 16 Determination of pKa of Unknown Acid Volume at equivalence point: Volume at one half equivalence point: - pka: Ka: Show work below: Concentration of Unknown Weak Acid and HCI Unknown Acid HCl Volume of Acid Molarity of NaOH mL of NaOH at equivalence...
I have to complete a lab report for a class using data collected
and I have no idea how to use this data. Please help!
Name Date REPORT SHEET Weak Acid vs. Strong Acid Titration EXPERIMENT 16 Determination of pKa of Unknown Acid Volume at equivalence point: Volume at one half equivalence point: - pka: Ka: Show work below: Concentration of Unknown Weak Acid and HCI Unknown Acid HCl Volume of Acid Molarity of NaOH mL of NaOH at equivalence...
The data on the below shows the number of hours a particular drug is in the...
The data on the below shows the number of hours a particular drug is in the system of 200 females. Develop a histogram of this data according to the following intervals: Follow the directions. Test the hypothesis that these data are distributed exponentially. Determine the test statistic. Round to two decimal places. (sort the data first) [0, 3) [3, 6) [6, 9) [9, 12) [12, 18) [18, 24) [24, infinity) 34.7 11.8 10 7.8 2.8 20 9.8 20.4 1.2 7.2...
a) Insert here a copy of the plot for the heating curve you created in laboratory....
a) Insert here a copy of the plot for the heating curve you created in laboratory. Remember that an acceptable plot has labels and units on the axes, a legend, and a title. PLOT GRAPH Run 1 Time Temperature T T min °C 0.0 22.0 0.2 22.0 0.5 22.1 0.8 21.9 1.0 22.2 1.2 22.1 1.5 22.1 1.8 22.3 2.0 22.0 2.2 21.9 2.5 22.0 2.8 22.2 3.0 22.7 3.2 23.6 3.5 24.7 3.8 26.5 4.0 28.0 4.2 29.6 4.5 ...
 2.2.33 Question Help Use the relative frequency table shown to the right to calculate the number of the 600 measurements falling into each of the measurement classes. Then graph a frequency histogram for these data Measurement Class 2.5-4.5 4.5-6.5 6.5-8.5 8.5-10.5 10.5-12.5 12.5-14.5 14.5-16.5 Relative Frequency 0.10 0.10 0.05 0.10 0.25 0.20 0.15 0.05 Calculate the number of measurements that fall into each class Measurement Class Frequen 0.5-2.5
 Math shown is statistics
2.2 Graphical Methods for Describing Quantitative Data 1. Consider the stem-and-leaf display below, leaf unit-0.1 Stem Leaf 0 012 1 2248 2 1134599 3 00036 4 457 5 13 How many observations in the data set? How do you decide? yhe mwntbers a) b) Re-create all numbers, order them in descending order. c) Construct a dot plot. The following relative frequency table is for a data set of 300 observations. a) 2. Fill the frequency column...
Math shown is statistics
2.2 Graphical Methods for Describing Quantitative Data 1. Consider the stem-and-leaf display below, leaf unit-0.1 Stem Leaf 0 012 1 2248 2 1134599 3 00036 4 457 5 13 How many observations in the data set? How do you decide? yhe mwntbers a) b) Re-create all numbers, order them in descending order. c) Construct a dot plot. The following relative frequency table is for a data set of 300 observations. a) 2. Fill the frequency column...
 Consider 500 measurements summarized in the accompanying frequency table Measurement 0.5-under 2.5 2.5-under 4.5 4.5-under 6.5 6.5-under 8.5 8.5-under 10.5 10.5-under 12.5 12.5-under 14.5 14.5-under 16.5 Class Frequency 50 75 125 100 25 50 50 25 What is the mean for this sample data? 7.5 7.3 9.1 Consider the previous grouped sample data, what is the variance for this sample? 17.0 15.59 18.15 15.01
 USE THE FOLLOWING FREQUENCY DISTRIBUTION FOR QUESTIONS 46-50. The following expanded frequency distribution was created from a sample of size 25. Class Limits f Class Midpoint Class Boundaries Relative Frequency Cumulative Frequency 5-8 5 6.5 0.2 5 4.5-8.5 9-12 0.56 19 13-16 6 14.5 12.5-16.5 46) Find the missing frequency (frequency for the class 9-12). A) 10.5 B) 0.24 C) 25 D) 8.5-12.5 E) 14 47) Find the Cumulative Frequency for the class 13-16 A) 10.5 B) 0.24 C) 25...
 The answers for both are given
Answer for a)
Answer for b)
I need a detail explanation of how to find the
DENSITY histogram. Thanks
5.4.5 suppose the following sample of size of n process. 20 is obtained from an industrial 3.9 7.2 6.94.55.8 3.74.4 4.5 5.6 2.5 4.8 8.5 4.3 1.2 2.3 3.1 3.4 4.8 1.8 3.7 (a) Construct a density histogram for this data set using the intervals (1, 4.5], (4.5, 5.5] (5.5, 6.51(6.5, 10] (b) Construct a...
The answers for both are given
Answer for a)
Answer for b)
I need a detail explanation of how to find the
DENSITY histogram. Thanks
5.4.5 suppose the following sample of size of n process. 20 is obtained from an industrial 3.9 7.2 6.94.55.8 3.74.4 4.5 5.6 2.5 4.8 8.5 4.3 1.2 2.3 3.1 3.4 4.8 1.8 3.7 (a) Construct a density histogram for this data set using the intervals (1, 4.5], (4.5, 5.5] (5.5, 6.51(6.5, 10] (b) Construct a...
 EXPLAIN Hου WE Ger THE CuASS AND CLASS UALUES FROm THE SAMPLE DATA2 OTHERS . ... ANO A frequency table for the size of surface blemishes in mm on a sample of steel castings is shown below. Defect Size (mm 14 S8 912 1356 17-20 21-24 25-28 Frequency 18 25 10 2 We shall use this grouped data to determine the mode, meun and median for blemish size The middle value of each interval is taken as the cless value...
 3. Based on the integration of the peaks, what is the relative
number of protons which make up each signal?
4. Identify any common splitting patterns. (ie. Isopropyl,
ethyl, etc)
UN (43 MIL.) 10.02s, 1H), 7.716.J-2 Hz. ) 2.0 11.5 11.0 10.5 10.0 9.5 9.0 8.5 8.0 7.5 7.0 6.5 6.0 4.0 3.5 3.0 2.5 20 15 100.5 0.0 -0.5 -1.0 -1.5 -2. 5.5 5.0 4.5 fl (ppm)
3. Based on the integration of the peaks, what is the relative
number of protons which make up each signal?
4. Identify any common splitting patterns. (ie. Isopropyl,
ethyl, etc)
UN (43 MIL.) 10.02s, 1H), 7.716.J-2 Hz. ) 2.0 11.5 11.0 10.5 10.0 9.5 9.0 8.5 8.0 7.5 7.0 6.5 6.0 4.0 3.5 3.0 2.5 20 15 100.5 0.0 -0.5 -1.0 -1.5 -2. 5.5 5.0 4.5 fl (ppm)
 I have to complete a lab report for a class using data collected
and I have no idea how to use this data. Please help!
Name Date REPORT SHEET Weak Acid vs. Strong Acid Titration EXPERIMENT 16 Determination of pKa of Unknown Acid Volume at equivalence point: Volume at one half equivalence point: - pka: Ka: Show work below: Concentration of Unknown Weak Acid and HCI Unknown Acid HCl Volume of Acid Molarity of NaOH mL of NaOH at equivalence...
I have to complete a lab report for a class using data collected
and I have no idea how to use this data. Please help!
Name Date REPORT SHEET Weak Acid vs. Strong Acid Titration EXPERIMENT 16 Determination of pKa of Unknown Acid Volume at equivalence point: Volume at one half equivalence point: - pka: Ka: Show work below: Concentration of Unknown Weak Acid and HCI Unknown Acid HCl Volume of Acid Molarity of NaOH mL of NaOH at equivalence...
Most questions answered within 3 hours.
-
Describe two obstacles that makes fixing atmospheric nitrogen
difficult.
asked 39 seconds ago -
T
F 53) Most differences
between human groups are the result of biology rather than
culture....
asked 5 minutes ago -
A 5.20 mW helium neon laser emits a visible laser beam with a
wavelength of 633...
asked 8 minutes ago -
Assignment:
Your
organization has made a strategic decision
to
outsourcework
currently performed in house. You have...
asked 6 minutes ago -
A hospital performs 100 surgeries per week. The probability that
complications after surgery occur is 10%....
asked 7 minutes ago -
In preparing its cash flow statement for the year ended December
31, 2018, Green Co. gathered...
asked 9 minutes ago -
Donna is 18 years old and full time accounting student.She is
saving for an overseas holiday...
asked 9 minutes ago -
Service-oriented architectures (SOA) provide
object-oriented architectures for web platforms that represent a
collection of services. SOA...
asked 10 minutes ago -
Le Terroir Winery is considering an expansion project to produce
fine wines. The trial expansion will...
asked 19 minutes ago -
The Bahraini public budget experiences deficit in the last
seven years, what are procedures are taken...
asked 26 minutes ago -
You invested $30,000 in a mutual fund at the beginning of the
year when the NAV...
asked 30 minutes ago -
Would you expect the price elasticity of supply for guitars to
be more inelastic in the...
asked 32 minutes ago