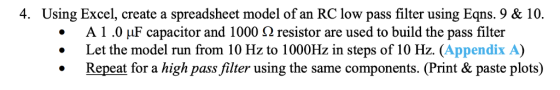

I need help with this question. I will give you 100% rating. Thanks.
Equations 9 & 10 provided in second image
)- 1 |ндою 1+ (оCR)* (9) arg (HGw)) — -tan-1 (оCR) (10)
Homework Answers
LOW PASS FILTER:


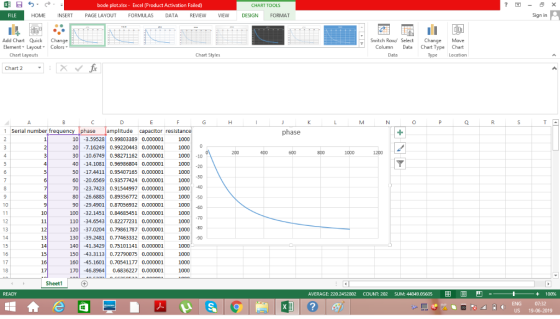
HIGH PASS FILTER:
AMPLITUDE = wRC / 
Angle = tan-1(wRC)


Add Answer to:
I need help with this question. I will give you 100% rating.
Thanks.
Equations 9 &...
I need help with Matlab code. Thank you Consider the RC Circuit shown below. Assume the...
 I need help with Matlab code. Thank you
Consider the RC Circuit shown below. Assume the excitation is a 10 kHz sine wave with amplitude of 1 volt. Derive expressions for the voltages across the resistor and the capacitor as time functions. Plot the voltages across the resistor and the capacitor over two periods using MATLAB and a reasonable time interval (eg, = T 20) Capture the plot and paste it as Figure 1 in the report form
I need help with Matlab code. Thank you
Consider the RC Circuit shown below. Assume the excitation is a 10 kHz sine wave with amplitude of 1 volt. Derive expressions for the voltages across the resistor and the capacitor as time functions. Plot the voltages across the resistor and the capacitor over two periods using MATLAB and a reasonable time interval (eg, = T 20) Capture the plot and paste it as Figure 1 in the report form
I NEED HELP WITH QUESTION #5 PLEASE AND CAN SOME FILL OUT THE FIRST ROW OF...
 I NEED HELP WITH QUESTION #5 PLEASE AND CAN SOME FILL OUT THE
FIRST ROW OF MY TABLE FOR 10Hz. I DONT KNOW HOW TO DO IT SO IF SOME
CAN FILL OUT THE FIRST TABLE AND SHOW ME HOW, THEN I CAN FINISH THE
REST. THANK YOU.
Reset Run / STOP 2uF Simulation Speed Current Speed 0 Power Brightness Current Circuit: 10Hz 1k New X S -15.933 V 100.165 ms 167.681 V capacitor, 2 UF 21.071 V resistor, 1...
I NEED HELP WITH QUESTION #5 PLEASE AND CAN SOME FILL OUT THE
FIRST ROW OF MY TABLE FOR 10Hz. I DONT KNOW HOW TO DO IT SO IF SOME
CAN FILL OUT THE FIRST TABLE AND SHOW ME HOW, THEN I CAN FINISH THE
REST. THANK YOU.
Reset Run / STOP 2uF Simulation Speed Current Speed 0 Power Brightness Current Circuit: 10Hz 1k New X S -15.933 V 100.165 ms 167.681 V capacitor, 2 UF 21.071 V resistor, 1...
Need help with matlab code. If writing code out please make it where i can understand...
 Need help with matlab code. If writing code out please make it
where i can understand and read it. I would prefer to see it in
matlab form. Thanks
Consider the RC Circuit shown below. Assume the excitation is a 10 kHz sine wave with amplitude of 1 volt. Derive expressions for the voltages across the resistor and the capacitor as time functions. Plot the voltages across the resistor and the capacitor over two periods using MATLAB and a reasonable...
Need help with matlab code. If writing code out please make it
where i can understand and read it. I would prefer to see it in
matlab form. Thanks
Consider the RC Circuit shown below. Assume the excitation is a 10 kHz sine wave with amplitude of 1 volt. Derive expressions for the voltages across the resistor and the capacitor as time functions. Plot the voltages across the resistor and the capacitor over two periods using MATLAB and a reasonable...
1. From Figure 9-2 and the equations above choose which plot best describes the impedance due...
 1. From Figure 9-2 and the equations above choose which
plot best describes the impedance due to:
a. A Resistor
b. A Capacitor
PART 1: IMPEDANCE OF A CAPACITOR PREPARATION In an AC circuit capacitors and inductors have an effective resistance that restricts the flow of current, this is known as impedance. An equivalent to Ohm's law can be written where resistance R is replaced by the impedance Z: V = 12 (9-4) where V and I are either...
1. From Figure 9-2 and the equations above choose which
plot best describes the impedance due to:
a. A Resistor
b. A Capacitor
PART 1: IMPEDANCE OF A CAPACITOR PREPARATION In an AC circuit capacitors and inductors have an effective resistance that restricts the flow of current, this is known as impedance. An equivalent to Ohm's law can be written where resistance R is replaced by the impedance Z: V = 12 (9-4) where V and I are either...
I need help with Q8 and Q12, the graphs and tables are for context. 07: How...
 I need help with Q8 and Q12, the graphs and tables are for
context.
07: How does the location of the current peak compare to the location of the voltage peak in each plot at 100 Hz? -101,186 V 271 735 ms 105.232 V capacitor, 2 F 132239 V resistor 1 169 V A/C source Figure 3 Screen capture of graphs in simulator for frequency of 100 Hz >Q8: Why does the resistor voltage increase as impedance decreases? >Q9: Which...
I need help with Q8 and Q12, the graphs and tables are for
context.
07: How does the location of the current peak compare to the location of the voltage peak in each plot at 100 Hz? -101,186 V 271 735 ms 105.232 V capacitor, 2 F 132239 V resistor 1 169 V A/C source Figure 3 Screen capture of graphs in simulator for frequency of 100 Hz >Q8: Why does the resistor voltage increase as impedance decreases? >Q9: Which...
part II is what I need help one. part 1 is also attached for your reference...
 part II is what I need help one. part 1 is also
attached for your reference
Part II: Low Pass Filter contd. Noise Removal To observe the noise removal capabilities of a low -pass filter, we will add a second input to the system to simulate noise Step 1: Alter your Simulink model by adding another sine wave function and use a Sum block to add the inputs together as the new input to the system. The second sine function...
part II is what I need help one. part 1 is also
attached for your reference
Part II: Low Pass Filter contd. Noise Removal To observe the noise removal capabilities of a low -pass filter, we will add a second input to the system to simulate noise Step 1: Alter your Simulink model by adding another sine wave function and use a Sum block to add the inputs together as the new input to the system. The second sine function...
QUESTION 1 Anna the Audiophile has asked for your help to build an amplifier and filter...
 QUESTION 1 Anna the Audiophile has asked for your help to build an amplifier and filter to take small signals from her hifi system and amplify them so that she can drive her new subwoofer. The hifi system produces AC signals at varying frequencies with 250mVrms maximum magnitude Her subwoofer requires the signals to be 20 Vrms maximum magnitude. The signals that Anna is interested in are below 200 Hz. She would like the filter to attenuate signals at frequencies...
checking to see if the answers i got are correct and help with the other parts....
 checking to see if the answers i got are correct and help with
the other parts. thank you
Chapter 26 Laboratory Application Assignment In this lab application assignment you will examine an RC coupling circuit and an RC low-pass filter. In the RC coulina circuit you will see how the series capacitor blocks the de component of the input voltage but passes the ac component. In the RC low-pass filter you will see how the low frequencies are passed from...
checking to see if the answers i got are correct and help with
the other parts. thank you
Chapter 26 Laboratory Application Assignment In this lab application assignment you will examine an RC coupling circuit and an RC low-pass filter. In the RC coulina circuit you will see how the series capacitor blocks the de component of the input voltage but passes the ac component. In the RC low-pass filter you will see how the low frequencies are passed from...
done on pspice thank you Part IV: Diode Rectifiers Procedure: 1. Build the circuit model for...
 done on pspice thank you
Part IV: Diode Rectifiers Procedure: 1. Build the circuit model for full-wave diode rectifier in PSpice as shown in Fig. 4. The value of the load resistor is 10 k22. The input AC voltage source (VSIN in PSpice) is configured at 100 Hz and 20 V (peak-to- peak) in sinusoidal waveform. O 10K V.(t) V(A) A Figure 4. Circuit configuration for full-wave diode rectifier 2. Run the simulation and save the input and output voltage...
done on pspice thank you
Part IV: Diode Rectifiers Procedure: 1. Build the circuit model for full-wave diode rectifier in PSpice as shown in Fig. 4. The value of the load resistor is 10 k22. The input AC voltage source (VSIN in PSpice) is configured at 100 Hz and 20 V (peak-to- peak) in sinusoidal waveform. O 10K V.(t) V(A) A Figure 4. Circuit configuration for full-wave diode rectifier 2. Run the simulation and save the input and output voltage...
1. In this class and in other physics lab classes you will often use oscilloscopes to...
 1. In this class and in other physics lab classes you will often use oscilloscopes to look at signal that change in time. Below is a sinusoidal AC signal on an oscilloscope screen. The vertical axis is set to 10 mV/division and the horizontal axis is set to 50 ms/division For the signal shown, what is the: a. Average voltage? b. Peak voltage? c. Peak-to-peak voltage? d. RMS voltage? e. Period? f. Frequency? g. If you were to write an...
 I need help with Matlab code. Thank you
Consider the RC Circuit shown below. Assume the excitation is a 10 kHz sine wave with amplitude of 1 volt. Derive expressions for the voltages across the resistor and the capacitor as time functions. Plot the voltages across the resistor and the capacitor over two periods using MATLAB and a reasonable time interval (eg, = T 20) Capture the plot and paste it as Figure 1 in the report form
I need help with Matlab code. Thank you
Consider the RC Circuit shown below. Assume the excitation is a 10 kHz sine wave with amplitude of 1 volt. Derive expressions for the voltages across the resistor and the capacitor as time functions. Plot the voltages across the resistor and the capacitor over two periods using MATLAB and a reasonable time interval (eg, = T 20) Capture the plot and paste it as Figure 1 in the report form
 I NEED HELP WITH QUESTION #5 PLEASE AND CAN SOME FILL OUT THE
FIRST ROW OF MY TABLE FOR 10Hz. I DONT KNOW HOW TO DO IT SO IF SOME
CAN FILL OUT THE FIRST TABLE AND SHOW ME HOW, THEN I CAN FINISH THE
REST. THANK YOU.
Reset Run / STOP 2uF Simulation Speed Current Speed 0 Power Brightness Current Circuit: 10Hz 1k New X S -15.933 V 100.165 ms 167.681 V capacitor, 2 UF 21.071 V resistor, 1...
I NEED HELP WITH QUESTION #5 PLEASE AND CAN SOME FILL OUT THE
FIRST ROW OF MY TABLE FOR 10Hz. I DONT KNOW HOW TO DO IT SO IF SOME
CAN FILL OUT THE FIRST TABLE AND SHOW ME HOW, THEN I CAN FINISH THE
REST. THANK YOU.
Reset Run / STOP 2uF Simulation Speed Current Speed 0 Power Brightness Current Circuit: 10Hz 1k New X S -15.933 V 100.165 ms 167.681 V capacitor, 2 UF 21.071 V resistor, 1...
 Need help with matlab code. If writing code out please make it
where i can understand and read it. I would prefer to see it in
matlab form. Thanks
Consider the RC Circuit shown below. Assume the excitation is a 10 kHz sine wave with amplitude of 1 volt. Derive expressions for the voltages across the resistor and the capacitor as time functions. Plot the voltages across the resistor and the capacitor over two periods using MATLAB and a reasonable...
Need help with matlab code. If writing code out please make it
where i can understand and read it. I would prefer to see it in
matlab form. Thanks
Consider the RC Circuit shown below. Assume the excitation is a 10 kHz sine wave with amplitude of 1 volt. Derive expressions for the voltages across the resistor and the capacitor as time functions. Plot the voltages across the resistor and the capacitor over two periods using MATLAB and a reasonable...
 1. From Figure 9-2 and the equations above choose which
plot best describes the impedance due to:
a. A Resistor
b. A Capacitor
PART 1: IMPEDANCE OF A CAPACITOR PREPARATION In an AC circuit capacitors and inductors have an effective resistance that restricts the flow of current, this is known as impedance. An equivalent to Ohm's law can be written where resistance R is replaced by the impedance Z: V = 12 (9-4) where V and I are either...
1. From Figure 9-2 and the equations above choose which
plot best describes the impedance due to:
a. A Resistor
b. A Capacitor
PART 1: IMPEDANCE OF A CAPACITOR PREPARATION In an AC circuit capacitors and inductors have an effective resistance that restricts the flow of current, this is known as impedance. An equivalent to Ohm's law can be written where resistance R is replaced by the impedance Z: V = 12 (9-4) where V and I are either...
 I need help with Q8 and Q12, the graphs and tables are for
context.
07: How does the location of the current peak compare to the location of the voltage peak in each plot at 100 Hz? -101,186 V 271 735 ms 105.232 V capacitor, 2 F 132239 V resistor 1 169 V A/C source Figure 3 Screen capture of graphs in simulator for frequency of 100 Hz >Q8: Why does the resistor voltage increase as impedance decreases? >Q9: Which...
I need help with Q8 and Q12, the graphs and tables are for
context.
07: How does the location of the current peak compare to the location of the voltage peak in each plot at 100 Hz? -101,186 V 271 735 ms 105.232 V capacitor, 2 F 132239 V resistor 1 169 V A/C source Figure 3 Screen capture of graphs in simulator for frequency of 100 Hz >Q8: Why does the resistor voltage increase as impedance decreases? >Q9: Which...
 part II is what I need help one. part 1 is also
attached for your reference
Part II: Low Pass Filter contd. Noise Removal To observe the noise removal capabilities of a low -pass filter, we will add a second input to the system to simulate noise Step 1: Alter your Simulink model by adding another sine wave function and use a Sum block to add the inputs together as the new input to the system. The second sine function...
part II is what I need help one. part 1 is also
attached for your reference
Part II: Low Pass Filter contd. Noise Removal To observe the noise removal capabilities of a low -pass filter, we will add a second input to the system to simulate noise Step 1: Alter your Simulink model by adding another sine wave function and use a Sum block to add the inputs together as the new input to the system. The second sine function...
 QUESTION 1 Anna the Audiophile has asked for your help to build an amplifier and filter to take small signals from her hifi system and amplify them so that she can drive her new subwoofer. The hifi system produces AC signals at varying frequencies with 250mVrms maximum magnitude Her subwoofer requires the signals to be 20 Vrms maximum magnitude. The signals that Anna is interested in are below 200 Hz. She would like the filter to attenuate signals at frequencies...
 checking to see if the answers i got are correct and help with
the other parts. thank you
Chapter 26 Laboratory Application Assignment In this lab application assignment you will examine an RC coupling circuit and an RC low-pass filter. In the RC coulina circuit you will see how the series capacitor blocks the de component of the input voltage but passes the ac component. In the RC low-pass filter you will see how the low frequencies are passed from...
checking to see if the answers i got are correct and help with
the other parts. thank you
Chapter 26 Laboratory Application Assignment In this lab application assignment you will examine an RC coupling circuit and an RC low-pass filter. In the RC coulina circuit you will see how the series capacitor blocks the de component of the input voltage but passes the ac component. In the RC low-pass filter you will see how the low frequencies are passed from...
 done on pspice thank you
Part IV: Diode Rectifiers Procedure: 1. Build the circuit model for full-wave diode rectifier in PSpice as shown in Fig. 4. The value of the load resistor is 10 k22. The input AC voltage source (VSIN in PSpice) is configured at 100 Hz and 20 V (peak-to- peak) in sinusoidal waveform. O 10K V.(t) V(A) A Figure 4. Circuit configuration for full-wave diode rectifier 2. Run the simulation and save the input and output voltage...
done on pspice thank you
Part IV: Diode Rectifiers Procedure: 1. Build the circuit model for full-wave diode rectifier in PSpice as shown in Fig. 4. The value of the load resistor is 10 k22. The input AC voltage source (VSIN in PSpice) is configured at 100 Hz and 20 V (peak-to- peak) in sinusoidal waveform. O 10K V.(t) V(A) A Figure 4. Circuit configuration for full-wave diode rectifier 2. Run the simulation and save the input and output voltage...
 1. In this class and in other physics lab classes you will often use oscilloscopes to look at signal that change in time. Below is a sinusoidal AC signal on an oscilloscope screen. The vertical axis is set to 10 mV/division and the horizontal axis is set to 50 ms/division For the signal shown, what is the: a. Average voltage? b. Peak voltage? c. Peak-to-peak voltage? d. RMS voltage? e. Period? f. Frequency? g. If you were to write an...
Most questions answered within 3 hours.
-
Preparation of Benzoic Acid using a Grignard Reagent URGENT
1. During your Grignard formation, a small...
asked 1 minute ago -
At the peak of your career, your were earning $120,000 and
holding a top level position....
asked 3 minutes ago -
. A permanent magnet is dropped south-end-down through a horizontal
circular coil with a radius of...
asked 5 minutes ago -
Bernie's Beverages purchased some fixed assets classified as
5-year property for MACRS. The assets cost $28,000....
asked 19 minutes ago -
How many ATPs are produced from the catabolism of a 10-C
molecule of fatty acid under...
asked 23 minutes ago -
Before practicing a routine on the rings, a 64.8 kg gymnast
hangs motionless, with one hand...
asked 25 minutes ago -
If the K b of a weak base is 6.3 × 10 − 6 , what...
asked 32 minutes ago -
Which of the following is the minimum amount of moles of NaOH
that must be added...
asked 35 minutes ago -
Stories about organizational ________ provide important clues
about cultural values and norms.
a. myths
b. heroes...
asked 37 minutes ago -
Explain the criteria used in selecting a target market
BUS220 Retail Management, thank you!
asked 39 minutes ago -
Convert/Calculate the following:
Determine the identity of an elemental gas if 4.55 L weighing
35.4g, under...
asked 42 minutes ago -
Consider the equilibrium C(s)+ CO2(g) ⇌2 CO(g)
A 2.0 L flask contains a mixture of 0.10...
asked 41 minutes ago