Suppose that in Example 10.28 motion along the x-axis is set to zero. The object now moves...
Suppose that in Example 10.28 motion along the x-axis is set to zero. The object now moves only along the y-axis at 1 pixel per frame for 32 frames and then (instantaneously) reverses direction and moves in exactly the opposite direction for another 32 frames. What would Figs. 10.63 and 10.64 look like under these conditions?
EXAMPLE 10.28: Detection of a small moving object via the frequency domain.
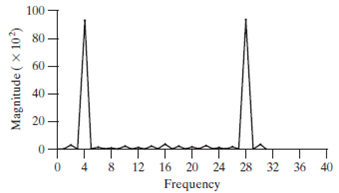
Figures 10.61 through 10.64 illustrate the effectiveness of the approach just derived. Figure 10.61 shows one of a 32-frame sequence of LANDSAT images generated by adding white noise to a reference image. The sequence contains a superimposed target moving at 0.5 pixel per frame in the x-direction and 1 pixel per frame in the y-direction. The target, shown circled in Fig. 10.62, has a Gaussian intensity distribution spread over a small (9-pixel) area and is not easily discernible by eye. Figures 10.63 and 10.64 show the results of computing Eqs. (10.6-8) and (10.6-9) with a1 = 6 and a2 = 4, respectively. The peak at u1 = 3 in Fig. 10.63 yields V1 = 0.5 from Eq. (10.6-10). Similarly, the peak at u2= 4 in Fig. 10.64 yields V2= 1.0 from Eq. (10.6-11).
![]() (10.6-8)
(10.6-8)
![]() (10.6-9)
(10.6-9)
![]() (10.6-10)
(10.6-10)
![]() (10.6-11)
(10.6-11)
FIGURE 10.61 LANDSAT frame. (Cowart, Snyder, and Ruedger.)
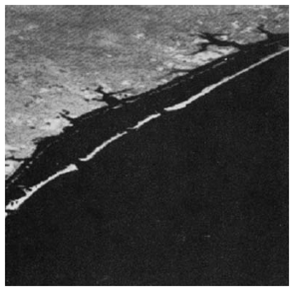
FIGURE 10.62 Intensity plot of the image in Fig. 10.61, with the target circled. (Rajala, Riddle, and Snyder.)
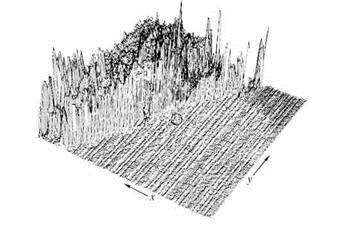
FIGURE 10.63 Spectrum of Eq. (10.6-8) showing a peak at u1 = 3. (Rajala, Riddle, and Snyder.)

Guidelines for the selection of a1and a2can be explained with the aid of Figs. 10.63 and 10.64. For instance, suppose that we had used a2= 15 instead of a2= 4. In that case the peaks in Fig. 10.64 would now be at u2= 15 and 17 because V2 = 1.0, which would be a seriously aliased result. As discussed in Section 4.5.4, aliasing is caused by undersampling (too few frames in the present discussion, as the range of u is determined by K). Because u = aV, one possibility is to select
FIGURE 10.64 Spectrum of Eq. (10.6-9) showing a peak at u2 = 4.(Rajala, Riddle, and Snyder.)
Step-by-Step Solution
Request Solution!
We need at least 10 more requests to produce the solution.
0 / 10 have requested this problem solution
The more requests, the faster the answer.
Most questions answered within 3 hours.
-
Calculating the space time for parallel reactions. m-Xylene is reacted over a ZSM-5 zeolit...
-
Determine Vo and ID for the networks of Fig. 2.160.FIG. 2.160
-
The truck travels along a circular road that has a radius of 50 m at a speed of 4 m/s. F...
-
A state legislature enacted a statute that required any motorcycle operator or passenger...
-
A 1024 × 1024 8-bit image with 5.3 bits/pixel entropy [computed from its histogram using E...
-
In Problem 3.3, we estimated the equationwhere we now report standard errors along with th...
-
In each of the following cases, deduce the nature of the light that is consistent with the...
-
Solve Example 20.5 such that the x, y, z axes move with curvilinear translation, Ω = 0 in...
-
In Fig. 6.43, if i = cos 4t and v = sin 4t, the element is:(a)a resistor(b) a capacitor(c)...
-
Sketch vo for each network of Fig. 2.181 for the input shown.FIG. 2.181
-
(Supplement B) Computing and Reporting Cash Flow Effectsof Sale of Plant and EquipmentDuri...
-
A 350-mL spherical flask contains 0.075 mol of an ideal gas at a temperature of 293 K. Wha...