
Homework Answers
Please refer to below spreadsheet for calculation and answer. Cell reference also provided.
Cell reference -

Hope this will help, please do comment if you need any further explanation. Your feedback would be highly appreciated.
Add Answer to:
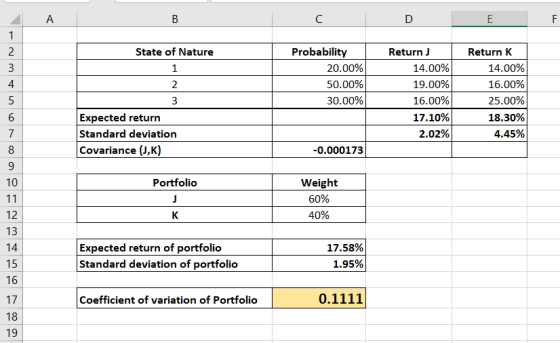
Question 7 5 pts You are given the following information for Securities J and K for...
QUESTION 5 Consider the performance of two securities, J and K over the five year period...
QUESTION 5 Consider the performance of two securities, J and K over the five year period from 2014 to 2018. The annual return earned on each one of them is as provided in the table below: Year J K % % 2014 37.9 -15.8 2015 28.4 19.8 2016 -0.1 12.8 2017 -50.0 -20.8 2018 31.7 58.6 Required: Compute the following: Assume your organization had K150 million to invest on 01st January, 2014. If 70% was invested in security J over...
JUS You are given the following correlation matrix for Securities J. K. and the Market: Correlation Security Securi...
 JUS You are given the following correlation matrix for Securities J. K. and the Market: Correlation Security Security K Market Security 1.00 0 .84 0.42 Security 0.84 1.00 0.30 Market 0.42 0.30 1.00 You know that the variance for J, K, and the Market are respectively: 0.0144004.0.0225000, and 0.0005760. Also, IRF = 0.02 and RPM - 0.05. Determine the required rate of return for Security J, based on the Capital Market Line. 33.25% 27.00% 30.50% 24.33% 22.00%
Question 7 5 pts Given the following information, calculate Eagle Fund's alpha: T-Bill Return: 5% S&P...
 Question 7 5 pts Given the following information, calculate Eagle Fund's alpha: T-Bill Return: 5% S&P 500 Return: 12% Beta: 0.85 Beginning Fund Value: $100 Ending Fund Value: $135 20.75% 8.40% 16.00% 24.05% 12.35%
Stock A and Stock B produced the following returns during the past five years (Year -1...
Stock A and Stock B produced the following returns during the past five years (Year -1 is one year ago, Year -2 is two years ago, and so forth): Year Stock A's Returns Stock B's Return -1 -16.00% -13.00% -2 31..40 28.00 -3 14.00 28.00 -4 -1.20 -7.40 -5 25.00 26.30 a. Calculate the average rate of return for each stock during the past five years. b. Assume that someone held a portfolio consisting of 50 percent Stock A and...
Problem 6-23 (similar to) Question Help (Portfolio beta and security market line) You own a portfolio...
 Problem 6-23 (similar to) Question Help (Portfolio beta and security market line) You own a portfolio consisting of the following stocks: The risk-free rate is 3 percent. Also, the expected return on the market portfolio is 13 percent. a. Calculate the expected return of your portfolio. (Hint: The expected return of a portfolio equals the weighted average of the individual stocks' expected returns, where the weights are the percentage invested in each stock.) b. Calculate the portfolio beta, c. Given...
J. P. Morgan Asset Management publishes information about financial investments. Over the past 10 years, the...
3. P. Morgan Asset Management publishes information about financial investments. Over the past 10 years, the expected retum for the S&P 500 was 5.04 %with a standard deviation of 19.45 %and the expected return over that same period for a Core Bonds fund was 5.78 %with a standard deviation of 2.13 %(J. P. Morgan Asset Management, Guide to the Markets, 1st Quarter, 2012). The publication also reported that the correlation between the Sap 500 and Core Bonds is -0.32. You...
Question 51 pts You have observed the following returns on Stock A's stocks over the last...
Question 51 pts You have observed the following returns on Stock A's stocks over the last five years: 2.65%, 7.38%, -1.3%, -3.43%, 16.32% What is the average return on the stock over this five-year period? Note: Enter your answer in percentages rounded off to two decimal points. Do not enter % in the answer box. If the answer is negative, do enter the negative sign. Question 61 pts You purchased 114 shares of Best Buy CO., Inc for $57.96 per...
Question 4 1 pts Consider the following information: State of Economy Probability of State of Economy...
 Question 4 1 pts Consider the following information: State of Economy Probability of State of Economy Portfolio Return if State Occurs Recession 0.20 - 0.08 Boom 0.80 0.15 Calculate the expected return of the given portfolio. (Do not round intermediate calculations. Round your answer to 3 decimal places and do not enter your answer as a percent. IE: write 0.315 instead of 31.5%.)
Question 121 pts You purchased one share of Best Buy CO., Inc for $59.38 per share....
Question 121 pts You purchased one share of Best Buy CO., Inc for $59.38 per share. The company paid a dividend of $7.08 per share during the year, and had an ending share price of $60. What is the percentage return? Note: Enter your answer in percentages rounded off to two decimal points. Do not enter % in the answer box. For example, if your answer is 0.12345 then enter as 12.35 in the answer box. Question 131 pts You...
Use the following information to answer the next seven questions. Suppose there are three potential states...
Use the following information to answer the next seven questions. Suppose there are three potential states of the economy for next year: good, normal, and bad. Each state has equal probability to occur, that is, the probability is 1/3 for all of them. Returns of asset A and B in each state are given in the following table. good normal bad A 0.20 0.08 -0.01 B 0.15 0.10 -0.04 1. Find out the expected return of a portfolio with equal...
 JUS You are given the following correlation matrix for Securities J. K. and the Market: Correlation Security Security K Market Security 1.00 0 .84 0.42 Security 0.84 1.00 0.30 Market 0.42 0.30 1.00 You know that the variance for J, K, and the Market are respectively: 0.0144004.0.0225000, and 0.0005760. Also, IRF = 0.02 and RPM - 0.05. Determine the required rate of return for Security J, based on the Capital Market Line. 33.25% 27.00% 30.50% 24.33% 22.00%
 Question 7 5 pts Given the following information, calculate Eagle Fund's alpha: T-Bill Return: 5% S&P 500 Return: 12% Beta: 0.85 Beginning Fund Value: $100 Ending Fund Value: $135 20.75% 8.40% 16.00% 24.05% 12.35%
 Problem 6-23 (similar to) Question Help (Portfolio beta and security market line) You own a portfolio consisting of the following stocks: The risk-free rate is 3 percent. Also, the expected return on the market portfolio is 13 percent. a. Calculate the expected return of your portfolio. (Hint: The expected return of a portfolio equals the weighted average of the individual stocks' expected returns, where the weights are the percentage invested in each stock.) b. Calculate the portfolio beta, c. Given...
 Question 4 1 pts Consider the following information: State of Economy Probability of State of Economy Portfolio Return if State Occurs Recession 0.20 - 0.08 Boom 0.80 0.15 Calculate the expected return of the given portfolio. (Do not round intermediate calculations. Round your answer to 3 decimal places and do not enter your answer as a percent. IE: write 0.315 instead of 31.5%.)
Most questions answered within 3 hours.
-
A mutual fund manager has a $20 million portfolio with a beta of
1.7. The risk-free...
asked 6 seconds from now -
What is the positive energy states in Dirac’s picture? It says
that it leaves an empty...
asked 25 seconds ago -
Given the following contribution margin income statement
Sales (15000 units 35
$/units)
asked 1 second from now -
Explain what we mean by "The electric field at the point marked
X is 10 N/C."...
asked 2 minutes ago -
The heights in feet of some of the girls of SEU
are: 5.8, 6.1, 5.9, 5.4, 5.6,...
asked 32 minutes ago -
Caspian Sea Drinks is considering the purchase of a new water
filtration system produced by Rube...
asked 37 minutes ago -
Compare and contrast the
social media of Pepsi and Coke? which one is most effective and...
asked 37 minutes ago -
1.
Who initiates a lockout?
Group of answer choices
management
employees
unions
arbitrators
asked 37 minutes ago -
Many celebrities and public figures have Twitter accounts with
large numbers of followers. However, some of...
asked 1 hour ago -
In #13-16, use the following information. At the 0.01 level of
significance, test the claim that...
asked 48 minutes ago -
Suppose you wanted to make a buffer with pH 3.00. What chemicals
would you grab off...
asked 1 hour ago -
A 195 g mass attached to a horizontal spring oscillates at a
frequency of 5.20 Hz...
asked 51 minutes ago