Hi, I need help with this question. Please explain in details how you got the answer with steps shown for each part so I can understand it thank you.

Homework Answers
Let's use excel:
First enter the given data sets in excel columns.
Click on Data >>>Data Analysis >>> Descriptive Statistics >>> OK
Select the required information
Look the following image:

Then click on OK, So we get the output:
Similarly do for data B,
Look the following output.
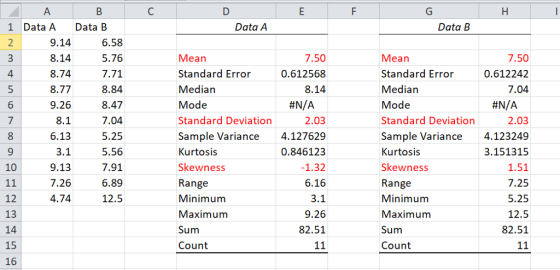
From the above output , we get:
For data A:
 = 7.50
s = 2.03
For data B:
= 7.50
s = 2.03
Skewness of data A = -1.32 ( negatively skewed )
Skeness of data B = 1.51 ( very Positively skewed).
so correct option is C. 
Add Answer to:
Hi, I need help with this question. Please explain in details
how you got the answer...
Big thumbs up if you can help! 7. Table 2.1 presents four sets of data prepared...
 Big thumbs up if you can help!
7. Table 2.1 presents four sets of data prepared by the statistician Frank Anscombe to illustrate the dangers of calculating without first plotting the data. Data Set A 11 146 12 10 8 13 8.04 6.95 7.58 8.81 8.33 9.96 7.24 4.26 10.84 4.82 5.68 Data SetB 10 8 13 11 146 12 9.14 8.14 8.74 8.77 9.26 8.10 6.133.109.13 7.26 4.74 ata Set C 10 8 13 911 14 6 12 7.46...
Big thumbs up if you can help!
7. Table 2.1 presents four sets of data prepared by the statistician Frank Anscombe to illustrate the dangers of calculating without first plotting the data. Data Set A 11 146 12 10 8 13 8.04 6.95 7.58 8.81 8.33 9.96 7.24 4.26 10.84 4.82 5.68 Data SetB 10 8 13 11 146 12 9.14 8.14 8.74 8.77 9.26 8.10 6.133.109.13 7.26 4.74 ata Set C 10 8 13 911 14 6 12 7.46...
12.35 12.35 x and s are not enough. The mean x and standard deviation s mea-...
 12.35
12.35 x and s are not enough. The mean x and standard deviation s mea- sure center and variability but are not a complete description of a distribu- tion. Data sets with different shapes can have the same mean and stan- dard deviation. To demonstrate this fact, use your calculator to find and s for these two small data sets. Then make a stemplot of each and commert on the shape of each distribution. Data A: 9.14 8.14 8.74...
12.35
12.35 x and s are not enough. The mean x and standard deviation s mea- sure center and variability but are not a complete description of a distribu- tion. Data sets with different shapes can have the same mean and stan- dard deviation. To demonstrate this fact, use your calculator to find and s for these two small data sets. Then make a stemplot of each and commert on the shape of each distribution. Data A: 9.14 8.14 8.74...
Response All estions From Part 0 A. Researchers compared forest plots that had never been logged...
 Response All estions From Part 0 A. Researchers compared forest plots that had never been logged (Group 1) with simil ar plots nearby that had been logged 1 year earlier (Group 2) and 8 years earlier (Group 3). All plots were 0.1 hectare in area. Here are the counts of trees for plots in each group: 16 20 24 Group I 27 Group Group 3 18 4 22 15 18 19 22 12 1 14 19 Towhat extent has logging...
Hi, I need help with this question. Please explain in details how you got the answer...
 Hi, I need help with this question. Please explain in details
how you got the answer with steps shown for each part so I can
understand it thank you.
The 2013-14 roster of the Seattle Seahawks, winners of the 2014 NFL Super Bowl, included 10 defensive linemen and 9 offensive linemen. (Data set may be found here.) The weights in pounds of the defensive linemen were 254 311 297 323 260 242 300 252 303 274 and the weights of...
Hi, I need help with this question. Please explain in details
how you got the answer with steps shown for each part so I can
understand it thank you.
The 2013-14 roster of the Seattle Seahawks, winners of the 2014 NFL Super Bowl, included 10 defensive linemen and 9 offensive linemen. (Data set may be found here.) The weights in pounds of the defensive linemen were 254 311 297 323 260 242 300 252 303 274 and the weights of...
Hi, I need help with this question. Please explain in details how you got the answer...
 Hi, I need help with this question. Please explain in details
how you got the answer with steps shown for each part so I can
understand it thank you.
The Department of Energy provides fuel economy ratings for all cars and light trucks sold in the United States. Here are the estimated miles per gallon for city driving for 30 cars classified as midsize, arranged in increasing order. 11 12 12 12 13 13 13 14 14 14 15 15...
Hi, I need help with this question. Please explain in details
how you got the answer with steps shown for each part so I can
understand it thank you.
The Department of Energy provides fuel economy ratings for all cars and light trucks sold in the United States. Here are the estimated miles per gallon for city driving for 30 cars classified as midsize, arranged in increasing order. 11 12 12 12 13 13 13 14 14 14 15 15...
Hi, I need help with this question. Please explain in details how you got the answer...
 Hi, I need help with this question. Please explain in details
how you got the answer with steps shown for each part so I can
understand it thank you.
Radon is a naturally occurring gas and is the second leading cause of lung cancer in the United States. It comes from the natural breakdown of uranium in the soil and enters buildings through cracks and other holes in the foundations. Found throughout the United States, levels vary considerably from state...
Hi, I need help with this question. Please explain in details
how you got the answer with steps shown for each part so I can
understand it thank you.
Radon is a naturally occurring gas and is the second leading cause of lung cancer in the United States. It comes from the natural breakdown of uranium in the soil and enters buildings through cracks and other holes in the foundations. Found throughout the United States, levels vary considerably from state...
Hi, I need help with this question. Please explain in details how you got the answer...
 Hi, I need help with this question. Please explain in details
how you got the answer with steps shown for each part so I can
understand it thank you. I am not sure why 2.9 is wrong.
How long does it take you to get from home to work? Here are the travel times in minutes for 15 workers in North Carolina, chosen at random by the Census Bureau 30 20 10 40 25 20 10 62 15 40 1...
Hi, I need help with this question. Please explain in details
how you got the answer with steps shown for each part so I can
understand it thank you. I am not sure why 2.9 is wrong.
How long does it take you to get from home to work? Here are the travel times in minutes for 15 workers in North Carolina, chosen at random by the Census Bureau 30 20 10 40 25 20 10 62 15 40 1...
I need help with 1a and 1b please. Can you explain how you got the answer...
 I need help with 1a and 1b please. Can you explain how you got
the answer to. It is for cellular and molecular biology. Ignore the
blue dot on figure b.
SKOV3-NV, SKOV3-C1, and SKOV3-C7 cells were treated with 0-12.5 M cisplatin (a) or 0-5 nM paclitaxel (b) for 48 h, at which time the cells were subjected to MTS assay to measure viability. C1 and C7 were transfected with an YFG (protein) over expressing construct, while NV was transfected...
I need help with 1a and 1b please. Can you explain how you got
the answer to. It is for cellular and molecular biology. Ignore the
blue dot on figure b.
SKOV3-NV, SKOV3-C1, and SKOV3-C7 cells were treated with 0-12.5 M cisplatin (a) or 0-5 nM paclitaxel (b) for 48 h, at which time the cells were subjected to MTS assay to measure viability. C1 and C7 were transfected with an YFG (protein) over expressing construct, while NV was transfected...
Hi, I need help with this question. Can you please explain in details thank you! Case...
 Hi, I need help with this question. Can you please explain in
details thank you!
Case Study 4: Uncoordinated Felix, a 54-year-old masonry contractor, has been complaining for the past three months about increasing arm weakness and that it is becoming more difficult to pick up and use his tools. He has recently been stumbling at his work site and his speech is, at times, difficult to understand because of poor word choices. He has also had worsening memory and...
Hi, I need help with this question. Can you please explain in
details thank you!
Case Study 4: Uncoordinated Felix, a 54-year-old masonry contractor, has been complaining for the past three months about increasing arm weakness and that it is becoming more difficult to pick up and use his tools. He has recently been stumbling at his work site and his speech is, at times, difficult to understand because of poor word choices. He has also had worsening memory and...
I need help with a,b,c, and d please and explain how you got it please. 1)...
 I need help with a,b,c, and d please and explain how you got it
please.
1) Answer the following questions based on the image above (10) A) What is the question being asked in figure parts A and B above (2)? B) What is the result (answer) to the question based on data shown in part A and B? Justify your answer by highlighting the data supporting your response (2). C) Propose a possible mechanism by which this protein could...
I need help with a,b,c, and d please and explain how you got it
please.
1) Answer the following questions based on the image above (10) A) What is the question being asked in figure parts A and B above (2)? B) What is the result (answer) to the question based on data shown in part A and B? Justify your answer by highlighting the data supporting your response (2). C) Propose a possible mechanism by which this protein could...
 Big thumbs up if you can help!
7. Table 2.1 presents four sets of data prepared by the statistician Frank Anscombe to illustrate the dangers of calculating without first plotting the data. Data Set A 11 146 12 10 8 13 8.04 6.95 7.58 8.81 8.33 9.96 7.24 4.26 10.84 4.82 5.68 Data SetB 10 8 13 11 146 12 9.14 8.14 8.74 8.77 9.26 8.10 6.133.109.13 7.26 4.74 ata Set C 10 8 13 911 14 6 12 7.46...
Big thumbs up if you can help!
7. Table 2.1 presents four sets of data prepared by the statistician Frank Anscombe to illustrate the dangers of calculating without first plotting the data. Data Set A 11 146 12 10 8 13 8.04 6.95 7.58 8.81 8.33 9.96 7.24 4.26 10.84 4.82 5.68 Data SetB 10 8 13 11 146 12 9.14 8.14 8.74 8.77 9.26 8.10 6.133.109.13 7.26 4.74 ata Set C 10 8 13 911 14 6 12 7.46...
 12.35
12.35 x and s are not enough. The mean x and standard deviation s mea- sure center and variability but are not a complete description of a distribu- tion. Data sets with different shapes can have the same mean and stan- dard deviation. To demonstrate this fact, use your calculator to find and s for these two small data sets. Then make a stemplot of each and commert on the shape of each distribution. Data A: 9.14 8.14 8.74...
12.35
12.35 x and s are not enough. The mean x and standard deviation s mea- sure center and variability but are not a complete description of a distribu- tion. Data sets with different shapes can have the same mean and stan- dard deviation. To demonstrate this fact, use your calculator to find and s for these two small data sets. Then make a stemplot of each and commert on the shape of each distribution. Data A: 9.14 8.14 8.74...
 Response All estions From Part 0 A. Researchers compared forest plots that had never been logged (Group 1) with simil ar plots nearby that had been logged 1 year earlier (Group 2) and 8 years earlier (Group 3). All plots were 0.1 hectare in area. Here are the counts of trees for plots in each group: 16 20 24 Group I 27 Group Group 3 18 4 22 15 18 19 22 12 1 14 19 Towhat extent has logging...
 Hi, I need help with this question. Please explain in details
how you got the answer with steps shown for each part so I can
understand it thank you.
The 2013-14 roster of the Seattle Seahawks, winners of the 2014 NFL Super Bowl, included 10 defensive linemen and 9 offensive linemen. (Data set may be found here.) The weights in pounds of the defensive linemen were 254 311 297 323 260 242 300 252 303 274 and the weights of...
Hi, I need help with this question. Please explain in details
how you got the answer with steps shown for each part so I can
understand it thank you.
The 2013-14 roster of the Seattle Seahawks, winners of the 2014 NFL Super Bowl, included 10 defensive linemen and 9 offensive linemen. (Data set may be found here.) The weights in pounds of the defensive linemen were 254 311 297 323 260 242 300 252 303 274 and the weights of...
 Hi, I need help with this question. Please explain in details
how you got the answer with steps shown for each part so I can
understand it thank you.
The Department of Energy provides fuel economy ratings for all cars and light trucks sold in the United States. Here are the estimated miles per gallon for city driving for 30 cars classified as midsize, arranged in increasing order. 11 12 12 12 13 13 13 14 14 14 15 15...
Hi, I need help with this question. Please explain in details
how you got the answer with steps shown for each part so I can
understand it thank you.
The Department of Energy provides fuel economy ratings for all cars and light trucks sold in the United States. Here are the estimated miles per gallon for city driving for 30 cars classified as midsize, arranged in increasing order. 11 12 12 12 13 13 13 14 14 14 15 15...
 Hi, I need help with this question. Please explain in details
how you got the answer with steps shown for each part so I can
understand it thank you.
Radon is a naturally occurring gas and is the second leading cause of lung cancer in the United States. It comes from the natural breakdown of uranium in the soil and enters buildings through cracks and other holes in the foundations. Found throughout the United States, levels vary considerably from state...
Hi, I need help with this question. Please explain in details
how you got the answer with steps shown for each part so I can
understand it thank you.
Radon is a naturally occurring gas and is the second leading cause of lung cancer in the United States. It comes from the natural breakdown of uranium in the soil and enters buildings through cracks and other holes in the foundations. Found throughout the United States, levels vary considerably from state...
 Hi, I need help with this question. Please explain in details
how you got the answer with steps shown for each part so I can
understand it thank you. I am not sure why 2.9 is wrong.
How long does it take you to get from home to work? Here are the travel times in minutes for 15 workers in North Carolina, chosen at random by the Census Bureau 30 20 10 40 25 20 10 62 15 40 1...
Hi, I need help with this question. Please explain in details
how you got the answer with steps shown for each part so I can
understand it thank you. I am not sure why 2.9 is wrong.
How long does it take you to get from home to work? Here are the travel times in minutes for 15 workers in North Carolina, chosen at random by the Census Bureau 30 20 10 40 25 20 10 62 15 40 1...
 I need help with 1a and 1b please. Can you explain how you got
the answer to. It is for cellular and molecular biology. Ignore the
blue dot on figure b.
SKOV3-NV, SKOV3-C1, and SKOV3-C7 cells were treated with 0-12.5 M cisplatin (a) or 0-5 nM paclitaxel (b) for 48 h, at which time the cells were subjected to MTS assay to measure viability. C1 and C7 were transfected with an YFG (protein) over expressing construct, while NV was transfected...
I need help with 1a and 1b please. Can you explain how you got
the answer to. It is for cellular and molecular biology. Ignore the
blue dot on figure b.
SKOV3-NV, SKOV3-C1, and SKOV3-C7 cells were treated with 0-12.5 M cisplatin (a) or 0-5 nM paclitaxel (b) for 48 h, at which time the cells were subjected to MTS assay to measure viability. C1 and C7 were transfected with an YFG (protein) over expressing construct, while NV was transfected...
 Hi, I need help with this question. Can you please explain in
details thank you!
Case Study 4: Uncoordinated Felix, a 54-year-old masonry contractor, has been complaining for the past three months about increasing arm weakness and that it is becoming more difficult to pick up and use his tools. He has recently been stumbling at his work site and his speech is, at times, difficult to understand because of poor word choices. He has also had worsening memory and...
Hi, I need help with this question. Can you please explain in
details thank you!
Case Study 4: Uncoordinated Felix, a 54-year-old masonry contractor, has been complaining for the past three months about increasing arm weakness and that it is becoming more difficult to pick up and use his tools. He has recently been stumbling at his work site and his speech is, at times, difficult to understand because of poor word choices. He has also had worsening memory and...
 I need help with a,b,c, and d please and explain how you got it
please.
1) Answer the following questions based on the image above (10) A) What is the question being asked in figure parts A and B above (2)? B) What is the result (answer) to the question based on data shown in part A and B? Justify your answer by highlighting the data supporting your response (2). C) Propose a possible mechanism by which this protein could...
I need help with a,b,c, and d please and explain how you got it
please.
1) Answer the following questions based on the image above (10) A) What is the question being asked in figure parts A and B above (2)? B) What is the result (answer) to the question based on data shown in part A and B? Justify your answer by highlighting the data supporting your response (2). C) Propose a possible mechanism by which this protein could...
Most questions answered within 3 hours.
-
if a firm producing 100 units at $5.00 each experience
an 80% experience curve, what will...
asked 20 minutes ago -
A solid, uniform disk of radius 0.250 m and mass 53.7 kg rolls
down a ramp...
asked 2 hours ago -
Given the following table of high speed internet access vs.
annual home income:
Home Income
%...
asked 3 hours ago -
A baseball batter hits a 0.145kg baseball straight up into the
air. The baseball leaves the...
asked 3 hours ago -
An FM modulator is tested using
single-tone baseband signal with frequency of 50kHz and a sprectrum...
asked 3 hours ago -
Write the ionic equations for the first stage of salts
hydrolysis.
Anion, Cation?
Na2S
NiSO4
K2SO4...
asked 5 hours ago -
suppose there is a normally distributed population with a mean of
250 and a standard deviation...
asked 6 hours ago -
Question Three
Suppose you as project manager are using the Waterfall
development methodology on a large...
asked 7 hours ago -
Which statement is not true about welfare in Canada?
A.Benefits typically vary based on one's ability...
asked 7 hours ago -
Please help me with FLOWCHART and UML diagram for class,
thank you!
#include <iostream>
#include <fstream>...
asked 8 hours ago -
3. Describe the “logic circuit” of the Lac operon. Which
proteins are bound or not to...
asked 8 hours ago -
Ayesha’s adjusted gross income is $60,000 in 2019. She donated a
piece of artwork with a...
asked 8 hours ago