Please use Rstudio to answer the following question. Thank you. In a double-blind experiment, healthy volunteers...
Please use Rstudio to answer the following question. Thank you.
In a double-blind experiment, healthy volunteers agreed to be exposed to a cold virus. They were either assigned to a control group (no echinacea but a placebo) or the group with echinacea. Here are the results Placebo group: 103 subjects 88 got a cold Echinacea group: 48 subjects 44 got a cold.
a. Calculate the proportions getting cold in each group.
b. Use a two-sample test to compare the proportions. In this case, use a continuity correction.
c. Give a 95% confidence interval for the difference comparing echinacea and placebo.
d. Comment on possible odditites in the study design?
Homework Answers
a)
Given,
Placebo group: 
Sample proportion, 
Echinacea group: 
Sample proportion, 
-------------------------------------------------------------------------------------------------------------
b)
Our hypothesis is,


Test statistics:

Where, 
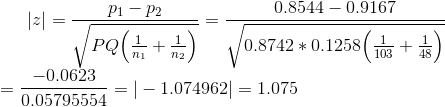
Using continuity correction subtract 0.5 from the absolute value i.e. 1.075-0.5 = 0.575
At 0.05 level of significance, critical z value is 1.96
Since, calculated z value is less than the critical z value, i.e.,

Therefore, we conclude that the proportion of two groups are insignificant.
-------------------------------------------------------------------------------------------------------------------------------
c).
95% confidence interval for 


Add Answer to:
Please use Rstudio to answer the following question. Thank
you.
In a double-blind experiment, healthy volunteers...
Echinacea is widely used as an herbal remedy for common cold, but does it work? Volunteers...
Echinacea is widely used as an herbal remedy for common cold, but does it work? Volunteers were randomly assigned to take either a placebo or an Echinacea supplement for 5 days following viral exposure. Among the 103 subjects taking Echinacea, 88 developed a cold, whereas 44 of 48 subjects taking a placebo developed a cold. (Make sure to check conditions) Construct a 97% confidence interval for the difference in the proportions of individuals developing a cold after viral exposure between...
Please use Rstudio to answer the following. Thank you. Sounds that are either a tone or...
Please use Rstudio to answer the following. Thank you. Sounds that are either a tone or a monkey call are fed into monkeys through electrodes attached to the brain. Of interest is a response measured by the firing rate (electric spikes per second). It is believed there are more spikes associated with calls than with tones. a. Use a paired test to analyze the data. Summarize results giving test statistics, df, p-value, and state null and alternative hypotheses. Note this...
please answer all questions and use the formula sheet below for question 23. 20) statistics students must be t ssume that we want to estimate the mean 10 score for the pogaoe that the sample mea...
 please answer all questions and use the formula sheet below
for question 23.
20) statistics students must be t ssume that we want to estimate the mean 10 score for the pogaoe that the sample mean is within statistics shudents. How many 95% confidence that the sample mean ts within andomly selected for 10 tests if we want 2 10 points of the population mean? Note that 10 tests are typicalls standard devintion is 15 error Ey? (a) Decrease ow...
please answer all questions and use the formula sheet below
for question 23.
20) statistics students must be t ssume that we want to estimate the mean 10 score for the pogaoe that the sample mean is within statistics shudents. How many 95% confidence that the sample mean ts within andomly selected for 10 tests if we want 2 10 points of the population mean? Note that 10 tests are typicalls standard devintion is 15 error Ey? (a) Decrease ow...
can you please solve those quations fast! please! thank you ! Question 9 6 pts For...
 can you please solve those quations fast! please! thank you
!
Question 9 6 pts For each of the following research questions, determine whether an observational study, an experiment, or neither should be used to answer the question. Note - each term on the right may be used more than once or not at all. Does learner-centered instruction increase student success rates in math? Experiment Observational study Is a student who successfully completes a college-level math class within 14 months...
can you please solve those quations fast! please! thank you
!
Question 9 6 pts For each of the following research questions, determine whether an observational study, an experiment, or neither should be used to answer the question. Note - each term on the right may be used more than once or not at all. Does learner-centered instruction increase student success rates in math? Experiment Observational study Is a student who successfully completes a college-level math class within 14 months...
You must attempt all questions. You must use Minitab and/or Excel to solve all questions. Show...
You must attempt all questions. You must use Minitab and/or Excel to solve all questions. Show all of your works. State your hypothesis if required, Do NOT give the numerical final answer only, you MUST comment on all of your final finding. If required, use ?=0.05 for all the tests. Q1) 10 points A study of speeding violations and drivers who use cell phones produced the following fictional data: Speeding ticket No speeding ticket Uses cell phone while driving 40...
 please answer all questions and use the formula sheet below
for question 23.
20) statistics students must be t ssume that we want to estimate the mean 10 score for the pogaoe that the sample mean is within statistics shudents. How many 95% confidence that the sample mean ts within andomly selected for 10 tests if we want 2 10 points of the population mean? Note that 10 tests are typicalls standard devintion is 15 error Ey? (a) Decrease ow...
please answer all questions and use the formula sheet below
for question 23.
20) statistics students must be t ssume that we want to estimate the mean 10 score for the pogaoe that the sample mean is within statistics shudents. How many 95% confidence that the sample mean ts within andomly selected for 10 tests if we want 2 10 points of the population mean? Note that 10 tests are typicalls standard devintion is 15 error Ey? (a) Decrease ow...
 can you please solve those quations fast! please! thank you
!
Question 9 6 pts For each of the following research questions, determine whether an observational study, an experiment, or neither should be used to answer the question. Note - each term on the right may be used more than once or not at all. Does learner-centered instruction increase student success rates in math? Experiment Observational study Is a student who successfully completes a college-level math class within 14 months...
can you please solve those quations fast! please! thank you
!
Question 9 6 pts For each of the following research questions, determine whether an observational study, an experiment, or neither should be used to answer the question. Note - each term on the right may be used more than once or not at all. Does learner-centered instruction increase student success rates in math? Experiment Observational study Is a student who successfully completes a college-level math class within 14 months...
Most questions answered within 3 hours.
-
An object in front of a concave mirror has a real image that is
11.5 cm...
asked 4 minutes ago -
Consider the reaction, C3 H8 + O2 --> CO2 + H2O. How many
moles of O2...
asked 1 hour ago -
You and your opponent both roll a fair die. If you both roll the
same number,...
asked 2 hours ago -
In a study of the accuracy of fast food drive-through orders,
Restaurant A had 257 accurate...
asked 2 hours ago -
Identify and describe in detail the four categories of
institutions that could be included in a...
asked 2 hours ago -
In python
class Customer:
def __init__(self, customer_id, last_name, first_name, phone_number, address):
self._customer_id = int(customer_id)
self._last_name =...
asked 2 hours ago -
What is an example of a limitation in implementing a new
ERP system and how it...
asked 2 hours ago -
In a section of 9.7cm of an artery with a radius of 2.6mm there
is a...
asked 2 hours ago -
the two carboxylic acid groups of aspartic acid have different
acidities with pKa values of 2.1...
asked 2 hours ago -
Would CuCO3 aqueous salt combined with calcium chloride
form a solid precipitate? If so, what would...
asked 2 hours ago -
How do ECM Solutions assist in embedding a culture of continuous
improvement in an organization? (Project...
asked 2 hours ago -
Directions
These directions introduce the idea of Essential Questions.
Since this may be a new concept...
asked 2 hours ago