Question 1 Consider two risky assets A and B with E(rA)= 15%, Sigma_A= 32%, E(rB)= 0.09,...
Question 1
Consider two risky assets A and B with E(rA)= 15%, Sigma_A= 32%, E(rB)= 0.09, Sigma_B= 23%, corrA,B= 0.2. The risk free rate is 5%. The optimal risky portfolio of comprised of the two risky assets is to allocate 64% to A and the rest to B. What is the standard deviation of the optimal risky portfolio ?
Select one:
a. 20.75%
b. 23.61%
c. 22.86%
d. 23.00%
Question 2
Continued with previous question. What is the Sharpe ratio of the optimal risky portfolio?
Select one:
a. 0.33
b. 0.35
c. 0.31
d. 0.29
Question 3
Continue to use the information given in previous two questions.
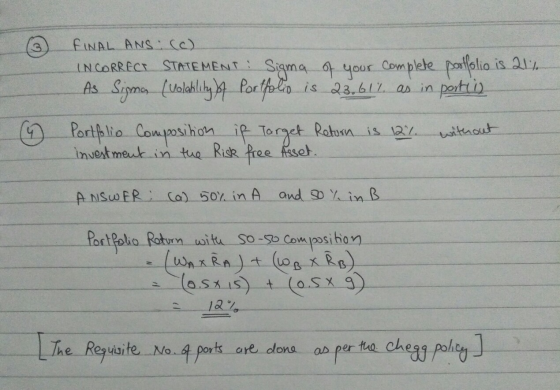
If your target expected return is 12%, lower than the expected return of the optimal risky portfolio, which is comprised of 64% risky asset A and 36% risky asset B, which of the following statements is not correct?
Select one:
a. invest 89.16% of your capital in this optimal risky portfolio and the rest in the risk-free asset
b. The asset allocation is 57.06% in A, 32.10% in B and 10.84% in the risk-free.
c. The sigma of your complete portfolio is 21%
d. not invest in the optimal risky portfolio but choose another portfolio on the investment opportunity set that has expected return of 12%.
Question 4
Continue to use the information from previous questions.
If you only invest in the two risky assets A and B, not the risk-free asset and your target expected return is still 12%, what should be the portfolio composition ?
Select one:
a. 50% in A and 50% in B
b. 60% in A and 40% in B
c. 64% in A and 36% in B
d. 65% in A and 35% in B
Question 5
Compare the previous two portfolios with the same expected return of 12%, one with investment in the risk-free asset and another one without investment in the risk-free asset. Which of the following statements is NOT correct?
Select one:
a. The portfolio without investment in the risk-free asset situates to the left of the optimal risky portfolio on the same capital allocation line.
b. The portfolio without investment in the risk-free asset sits on the investment opportunity set comprised of the two risky assets A and B.
c. The portfolio without investment in the risk-free asset has higher standard deviation than the portfolio with investment in the risk-free asset.
d. The portfolio without investment in the risk-free asset locates below the optimal capital allocation line.
Homework Answers

Add Answer to:
Question 1
Consider two risky assets A and B with E(rA)= 15%, Sigma_A= 32%,
E(rB)= 0.09,...
Question 1 Consider two risky assets A and B with E(rA)= 15%, Sigma_A= 32%, E(rB)= 0.09,...
Question 1 Consider two risky assets A and B with E(rA)= 15%, Sigma_A= 32%, E(rB)= 0.09, Sigma_B= 23%, corrA,B= 0.2. The risk free rate is 5%. The optimal risky portfolio of comprised of the two risky assets is to allocate 64% to A and the rest to B. What is the standard deviation of the optimal risky portfolio ? Select one: a. 20.75% b. 23.61% c. 22.86% d. 23.00% Question 2 Continued with previous question. What is the Sharpe ratio...
Consider two risky assets A and B with E(rA)= 15%, Sigma= 32%, E(rB)= 0.09, Sigma B=...
Consider two risky assets A and B with E(rA)= 15%, Sigma= 32%, E(rB)= 0.09, Sigma B= 23%, corrA,B= 0.2. The risk free rate is 5%. The optimal risky portfolio of comprised of the two risky assets is to allocate 64% to A and the rest to B. What is the standard deviation of the optimal risky portfolio
Consider two risky assets A and B with E(rA)= 15%, E(rB)= 9%, sigma_A= 0.32, sigma_B= 0.23,...
Consider two risky assets A and B with E(rA)= 15%, E(rB)= 9%, sigma_A= 0.32, sigma_B= 0.23, corr= 0.15. If you wan to create a portfolio with expected return of 12%. Your portfolio weight in Asset A (WA) should be Select one: a. 30% b. 50% c. 25% d. 40%
1. Consider a portfolio P comprised of two risky assets (A and B) whose returns have...
1. Consider a portfolio P comprised of two risky assets (A and B) whose returns have a correlation of zero. Risky asset A has an expected return of 10% and standard deviation of 15%. Risky asset B has an expected return of 7% and standard deviation of 11%. Assuming a risk-free rate of 2.5%, what is the standard deviation of returns on the optimal risky portfolio? a) 9.18% b) .918% c) .84% d) 8.42%
2. (Understanding optimal portfolio choice) Consider two risky assets, the expected return of asset one is...
 2. (Understanding optimal portfolio choice) Consider two risky assets, the expected return of asset one is μ-0.1, the expected return of asset two is μ2-0.15, the risk or standard deviation of asset one is σ1-0.1, the risk or standard deviation of asset two is σ2-02. The two assets also happen to have zero correlation. An investor plans to build a portfolio by investing w of his investment to asset one and the rest of his investment to asset two. Calculate...
Question 1: Suppose there are two risky assets, A and B. You collect the following data...
 Question 1: Suppose there are two risky assets, A and B. You collect the following data on probabilities of different states happening and the returns of the two risky assets in different states: State Probability Return Asset A Return Asset B State 10.3 7% 14% State 20.4 6% -4% State 30.3 -8% 8% The risk-free rate of return is 2%. (a) Calculate expected returns, variances, standard deviations, covariance, and correlation of returns of the two risky assets. (b) There are...
please help and show your work! Consider a market model with three assets: two risky assets...
 please help and show your work!
Consider a market model with three assets: two risky assets (#1 and #2) and one risk-free asset (#3). The risk-free rate of interest is r = 3%. The parameters of the risky returns are as follows: 02 = 15%, Mi = 6%, H2 = 9%, 01 = 10%, P12 = -10%. 1. Let u(x) and g(x) with xe (-0,00) denote, respectively, the expected return and volatility of my portfolio if I allocate 100x% of...
please help and show your work!
Consider a market model with three assets: two risky assets (#1 and #2) and one risk-free asset (#3). The risk-free rate of interest is r = 3%. The parameters of the risky returns are as follows: 02 = 15%, Mi = 6%, H2 = 9%, 01 = 10%, P12 = -10%. 1. Let u(x) and g(x) with xe (-0,00) denote, respectively, the expected return and volatility of my portfolio if I allocate 100x% of...
The universe of available securities includes two risky stocks A and B, and a risk-free asset....
The universe of available securities includes two risky stocks A and B, and a risk-free asset. The data for the universe are as follows: Assets Expected Return Standard Deviation Stock A 6% 25% Stock B 12% 42% Risk free 5% 0 The correlation coefficient between A and B is -0.2. The investor maximizes a utility function U=E(r)−σ2 (i.e. she has a coefficient of risk aversion equal to 2). Assume that to maximize his utility when there is no available risk-free...
2. Consider an economy with 2 risky assets and one risk free asset. Two investors, A...
 2. Consider an economy with 2 risky assets and one risk free asset. Two investors, A and B, have mean-variance utility functions (with different risk aversion coef- ficients). Let P denote investor A's optimal portfolio of risky and risk-free assets and let Q denote investor B's optimal portfolio of risky and risk-free assets. P and Q have expected returns and standard deviations given by P Q E[R] St. Dev. 0.2 0.45 0.1 0.25 (a) What is the risk-free interest rate...
Tom has $10,000. He can invest the money in (1) a corporate bond, (2) a stock,...
Tom has $10,000. He can invest the money in (1) a corporate bond, (2) a stock, and (3) the risk-free T-bill. The table below provides these assets’ expected returns and standard deviations: Bond (D) Stock (E) T-Bill (F) Expected Return 5% 10% 2% Standard Deviation 10% 20% 0 The coefficient of correlation between the corporate bond and the stock (ρDE) is 30%. Tom has a risk aversion coefficient of A=5. To construct the optimal portfolio with two risky assets and...
 2. (Understanding optimal portfolio choice) Consider two risky assets, the expected return of asset one is μ-0.1, the expected return of asset two is μ2-0.15, the risk or standard deviation of asset one is σ1-0.1, the risk or standard deviation of asset two is σ2-02. The two assets also happen to have zero correlation. An investor plans to build a portfolio by investing w of his investment to asset one and the rest of his investment to asset two. Calculate...
 Question 1: Suppose there are two risky assets, A and B. You collect the following data on probabilities of different states happening and the returns of the two risky assets in different states: State Probability Return Asset A Return Asset B State 10.3 7% 14% State 20.4 6% -4% State 30.3 -8% 8% The risk-free rate of return is 2%. (a) Calculate expected returns, variances, standard deviations, covariance, and correlation of returns of the two risky assets. (b) There are...
 please help and show your work!
Consider a market model with three assets: two risky assets (#1 and #2) and one risk-free asset (#3). The risk-free rate of interest is r = 3%. The parameters of the risky returns are as follows: 02 = 15%, Mi = 6%, H2 = 9%, 01 = 10%, P12 = -10%. 1. Let u(x) and g(x) with xe (-0,00) denote, respectively, the expected return and volatility of my portfolio if I allocate 100x% of...
please help and show your work!
Consider a market model with three assets: two risky assets (#1 and #2) and one risk-free asset (#3). The risk-free rate of interest is r = 3%. The parameters of the risky returns are as follows: 02 = 15%, Mi = 6%, H2 = 9%, 01 = 10%, P12 = -10%. 1. Let u(x) and g(x) with xe (-0,00) denote, respectively, the expected return and volatility of my portfolio if I allocate 100x% of...
 2. Consider an economy with 2 risky assets and one risk free asset. Two investors, A and B, have mean-variance utility functions (with different risk aversion coef- ficients). Let P denote investor A's optimal portfolio of risky and risk-free assets and let Q denote investor B's optimal portfolio of risky and risk-free assets. P and Q have expected returns and standard deviations given by P Q E[R] St. Dev. 0.2 0.45 0.1 0.25 (a) What is the risk-free interest rate...
Most questions answered within 3 hours.
-
A 50g ice cube is taken out of a freezer at 0 degrees Celsius
and put...
asked 38 minutes ago -
How do ratios help you determine trends? What specific
information do managers look at? Is there...
asked 41 minutes ago -
A wavelength of 514 nm is used to find an unknown diffraction
grating. If the separation...
asked 43 minutes ago -
Use the central limit theorem to find the mean and standard
error of the mean of...
asked 50 minutes ago -
You will be given a file that will contain averages for classes
which are divided into...
asked 58 minutes ago -
A Pew Research Center poll surveyed a random sample 850 voters
and asked them if they...
asked 1 hour ago -
Design a class named
NumDays, to
store a value that represents a number of hours and...
asked 1 hour ago -
(R)-2-chloro-(S)-3-bromobutane and
(S)-2-chloro-(S)-3-bromobutane are: A. enantiomers. B.
diastereomers. C. meso compounds. D. the same molecule.
asked 1 hour ago -
1_ What is the Frank-Starling law of the heart? And why the
heart cannot function on...
asked 1 hour ago -
The method of tree ring dating gave the following years A.D. for
an archaeological excavation site....
asked 1 hour ago -
Calculate (in N) the force a mother must exert to hold her 12.0
kg child in...
asked 1 hour ago -
A new lie-detector test has been devised and must be tested
before it is put into...
asked 1 hour ago