In Table 1, approximately what percentage of each treatment group was Caucasian?
A. 30%
B. 51%
C. 85%
D. The answer is not easily available from Table 1.
Homework Answers
Answer:
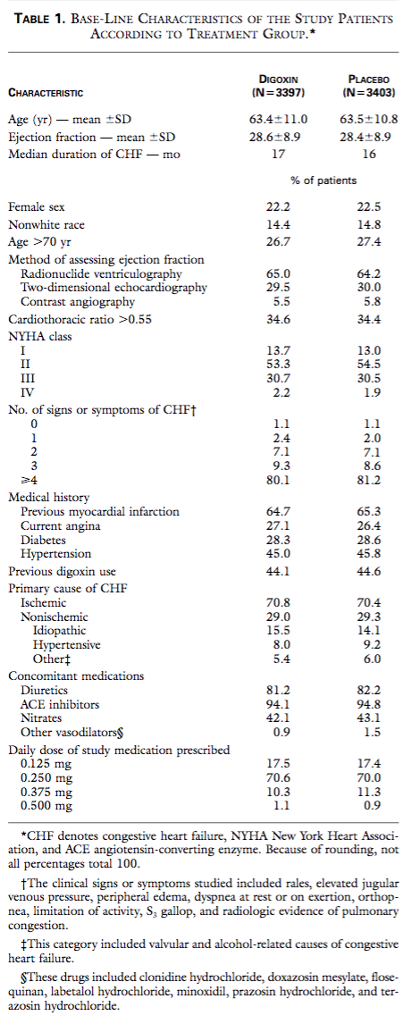
In Table 1, approximately what percentage of each treatment group was Caucasian?
A. 30%
B. 51%
Answer: C. 85%
D. The answer is not easily available from Table 1.
From the table, nonwhite race are 14.4% in Digoxin and 14.8% in Placebo Group. Therefore Caucasian or White are approximately 85 percentage in each group.
Add Answer to:
In Table 1, approximately what percentage of each treatment
group was Caucasian?
A. 30%
B. 51%...
. Based on Table 1, how well did the authors' control of confounding work? Based on...
 . Based on Table 1, how well did the authors' control of
confounding work?
Based on Table 1, how well did the authors’ control of
confounding work?
A. Very well; there were no statistically significant
differences between the Digoxin and Placebo groups
B. Moderately well; it would have been better if they had
matched on primary care of CHF
C. Poorly; there were several significant differences showing up
in Table 1
D. It’s impossible to judge based on Table 1...
. Based on Table 1, how well did the authors' control of
confounding work?
Based on Table 1, how well did the authors’ control of
confounding work?
A. Very well; there were no statistically significant
differences between the Digoxin and Placebo groups
B. Moderately well; it would have been better if they had
matched on primary care of CHF
C. Poorly; there were several significant differences showing up
in Table 1
D. It’s impossible to judge based on Table 1...
Most questions answered within 3 hours.
-
If authentic leadership is really a lifelong process,
can teenagers be authentic leaders? Why or why...
asked 12 minutes ago -
Six years of quarterly data of a seasonally adjusted series are
used to estimate a linear...
asked 30 minutes ago -
Which of the following is not an ecological model used
to foster behavior change?
PRECEDE-PROCEED Model...
asked 33 minutes ago -
On the Apollo 14 mission to the moon, astronaut Alan Shepard hit
a golf ball with...
asked 30 minutes ago -
What are John’s potential claims if he is terminated
this week?
John is a 54-year-old man...
asked 43 minutes ago -
A (8.5) cm tall object is placed at a distance of (14.2) cm from
a convex...
asked 52 minutes ago -
(2) For the following questions, consider a data set that
exhibits a normal distribution. Report the...
asked 53 minutes ago -
What exactly is an information system? How does it work" What
are its people organization,
...
asked 54 minutes ago -
The Food Marketing Institute shows that 17% of households spend
more than $100 per week on...
asked 1 hour ago -
Go to NCBI BLAST search web page
1st search: GEKDLRRAKDINQEVYNF
2nd search: PTSQRLQLLEPFDK
3rd search: GEKDLRRAKDINQEVYNF...
asked 1 hour ago -
Explain how each of the following three conditions could be a
red flag for a register...
asked 1 hour ago -
In a two-way factorial ANOVA, the final F-ratio for
factor AxB is determined by dividing _____...
asked 1 hour ago