
Homework Answers

Add Answer to:
(b) The figure to the right represents the normal curve with μ-266 days and σ 16...
b) The figure to the nght represents the normal curve with μ= 266 days and ơ-16...
 b) The figure to the nght represents the normal curve with μ= 266 days and ơ-16 days. The area between x. 286 and x 300 is 0 100. Provide t ten retat ons of tis area. o Provide one interpretation of the area. Select the correct choice below and fill in the answer boxes to complete your choice. Type integers or decimals. Do not round. Use ascending order) A. The proportion of human pregnancies that last between 285 and 300...
(a) The figure to the right represents the normal curve with μ = 266 days and...
 (a) The figure to the right represents the normal curve with μ = 266 days and σ = 16 days. The area to the right of X-290 is 0 0668 Provide two interpretations of this area. Provide one interpretation of the area. Select the correct choice below and fill in the answer boxes to complete your choice. (Type integers or decimals. Do not round.) A. The proportion of human pregnancies that last more than 290 days is 0.0668 The proportion...
Suppose the lengths of human pregnancies are normally distributed with 266 days and a = 16...
 Suppose the lengths of human pregnancies are normally distributed with 266 days and a = 16 days. Complete parts (a) and (b) below. a) The figure to the right represents the normal curve with 266 days and = 16 days. The area to the left of X = 230 is 0.0122. Provide two interpretations of this area Provide one interpretation of the area using the given values. Select the correct choice below and fill in the answer boxes to complete...
Provide a second interpretation of the area. Select the correct choice below and fil n the...
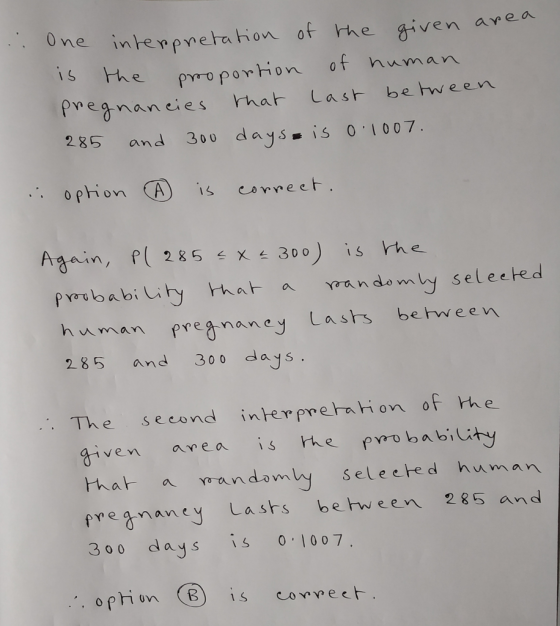
 Provide a second interpretation of the area. Select the correct choice below and fil n the answer boxes to complete your choice. (Type integers or decimals. Do not round) A. The probabity that a randomly selected human pregnancy lasts more than 290 days is 0 0668. O B. (b The figure to the right represents the normal curve with με 266 days and σ = 16 days. The area between : 285 and x :300 is 0.1007. Provide two interpretations...
o a Suppose the lengths of human pregnancies are normally distributed with p = 266 days...
 o a Suppose the lengths of human pregnancies are normally distributed with p = 266 days and 6 = 16 days. Complete parts (a) and (b) below. (a) The figure to the right represents the normal curve with u = 266 days and o = 16 days. The area to the right of X = 300 is 0.0168. Provide two interpretations of this area. Provide one interpretation of the area using the given values. Select the correct choice below and...
Suppose the legis of human pregnancies are normally distribuled with u-286 days and o- 16 days....
 Suppose the legis of human pregnancies are normally distribuled with u-286 days and o- 16 days. Cornplele parts (a) and (b) below. lal The figure to the right regreeente the normal curve with y - 286 days and o- 16 days. The area to the left of X - 245 is 0.09.7. Provide two interpretations of this ares. Pravide one interpretation of the area using the given values. Select the correct choice beow and fill in the answer boxes to...
Suppose the lengths of human pregnancies are normally distributed with muμequals=266 days and sigmaσequals=16days. Complete parts...
Suppose the lengths of human pregnancies are normally distributed with muμequals=266 days and sigmaσequals=16days. Complete parts (a) and (b) below. (a) The figure to the right represents the normal curve with mu equals 266μ=266 days and sigmaσequals=1616 days. The area to the leftleft of Upper X equals 240X=240 is 0.05210.0521. Provide two interpretations of this area. Provide one interpretation of the area using the given values. Select the correct choice below and fill in the answer boxes to complete your...
Question Help -uppose the lengths of human pregnancies are normally distributed with u = 266 days...
 Question Help -uppose the lengths of human pregnancies are normally distributed with u = 266 days and 6 = 16 days. Complete parts (a) and (b) below. (a) The figure to the right represents the normal curve with u = 266 days and o = 16 days. The area to the left of X = 245 is 0.0947. Provide two interpretations of this area Provide one interpretation of the area using the given values. Select the correct choice below and...
Suppose the lengths of human pregnancies are normally distributed with 266 days and ơ16 days. Complete...
 Suppose the lengths of human pregnancies are normally distributed with 266 days and ơ16 days. Complete parts a and b below. The f ure to he ri ht represents the normal curve with μ-2 6 days and : 16 days. The area to the right O X-290 is 0.0668, provide two interpretations of this area. a Provide one interpretation of the area. Select the correct choice below and fill in the answer boxes to complete your choice. Type integers or...
Suppose the lengths of human pregnancies are normally distributed with muμequals=266 days and sigmaσequals=16 days. Complete...
Suppose the lengths of human pregnancies are normally distributed with muμequals=266 days and sigmaσequals=16 days. Complete parts (a) and (b) below. (a) The figure to the right represents the normal curve with mu equals 266 days and sigmaσequals=16 days. The area to the left of Upper X equals 235 is 0.0263 Provide two interpretations of this area. Provide one interpretation of the area using the given values. Select the correct choice below and fill in the answer boxes to complete...
 b) The figure to the nght represents the normal curve with μ= 266 days and ơ-16 days. The area between x. 286 and x 300 is 0 100. Provide t ten retat ons of tis area. o Provide one interpretation of the area. Select the correct choice below and fill in the answer boxes to complete your choice. Type integers or decimals. Do not round. Use ascending order) A. The proportion of human pregnancies that last between 285 and 300...
 (a) The figure to the right represents the normal curve with μ = 266 days and σ = 16 days. The area to the right of X-290 is 0 0668 Provide two interpretations of this area. Provide one interpretation of the area. Select the correct choice below and fill in the answer boxes to complete your choice. (Type integers or decimals. Do not round.) A. The proportion of human pregnancies that last more than 290 days is 0.0668 The proportion...
 Suppose the lengths of human pregnancies are normally distributed with 266 days and a = 16 days. Complete parts (a) and (b) below. a) The figure to the right represents the normal curve with 266 days and = 16 days. The area to the left of X = 230 is 0.0122. Provide two interpretations of this area Provide one interpretation of the area using the given values. Select the correct choice below and fill in the answer boxes to complete...
 Provide a second interpretation of the area. Select the correct choice below and fil n the answer boxes to complete your choice. (Type integers or decimals. Do not round) A. The probabity that a randomly selected human pregnancy lasts more than 290 days is 0 0668. O B. (b The figure to the right represents the normal curve with με 266 days and σ = 16 days. The area between : 285 and x :300 is 0.1007. Provide two interpretations...
 o a Suppose the lengths of human pregnancies are normally distributed with p = 266 days and 6 = 16 days. Complete parts (a) and (b) below. (a) The figure to the right represents the normal curve with u = 266 days and o = 16 days. The area to the right of X = 300 is 0.0168. Provide two interpretations of this area. Provide one interpretation of the area using the given values. Select the correct choice below and...
 Suppose the legis of human pregnancies are normally distribuled with u-286 days and o- 16 days. Cornplele parts (a) and (b) below. lal The figure to the right regreeente the normal curve with y - 286 days and o- 16 days. The area to the left of X - 245 is 0.09.7. Provide two interpretations of this ares. Pravide one interpretation of the area using the given values. Select the correct choice beow and fill in the answer boxes to...
 Question Help -uppose the lengths of human pregnancies are normally distributed with u = 266 days and 6 = 16 days. Complete parts (a) and (b) below. (a) The figure to the right represents the normal curve with u = 266 days and o = 16 days. The area to the left of X = 245 is 0.0947. Provide two interpretations of this area Provide one interpretation of the area using the given values. Select the correct choice below and...
 Suppose the lengths of human pregnancies are normally distributed with 266 days and ơ16 days. Complete parts a and b below. The f ure to he ri ht represents the normal curve with μ-2 6 days and : 16 days. The area to the right O X-290 is 0.0668, provide two interpretations of this area. a Provide one interpretation of the area. Select the correct choice below and fill in the answer boxes to complete your choice. Type integers or...
Most questions answered within 3 hours.
-
4. How many input & output Key Value Pairs are passed into,
and emitted out of...
asked 27 minutes ago -
B. If compound Y has approximately the same values of solubility
in toluene as compound X,...
asked 16 minutes ago -
Oscar Inc. has inventory in Japan valued at 39,051,000 Yen one
year ago. One year ago...
asked 23 minutes ago -
If Canada suffered from "fundamental disequilibrium," and its
government choose not to devalue its currency, a...
asked 32 minutes ago -
Why would your heart not function well if constructed of
skeletal muscle? What is the particular...
asked 35 minutes ago -
Please respond to this essay question in full essay form for
Chemistry 1102 Organic and Biochemistry:...
asked 36 minutes ago -
Determine the head loss and velocity of flow in a water supply main
of 15.0 cm...
asked 38 minutes ago -
A marketing executive who knowingly authorizes a shoddy
defective product to be brought to market is...
asked 47 minutes ago -
Write a psudocode:
1. Define a function called authorize that takes in 2 strings,
uName, and...
asked 52 minutes ago -
What Hall voltage (in mV) is produced by a 0.180 T field applied
across a 2.60...
asked 51 minutes ago -
What mass of ethylene glycol (C2H6O2) must be added to 211.0 g
of water to obtain...
asked 53 minutes ago -
Mary's employer has a defined benefits retirement plan, which
pay 3.2% of her last year's salary...
asked 56 minutes ago