The table below shows an example of ANOVA table results. Comparing educational outcomes across five different...
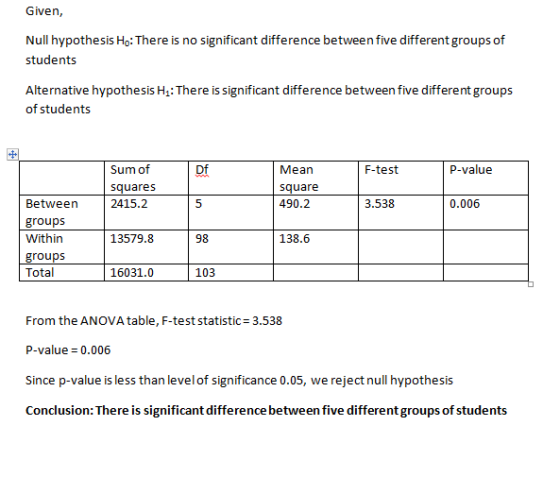
- The table below shows an example of ANOVA table results. Comparing educational outcomes across five different groups of students. Interpret the output and results.
|
Sum of squares |
df |
Mean square |
F-test |
p-value |
|
|
Between groups |
2415.2 |
5 |
490.2 |
3.538 |
0.006 |
|
Within groups |
13579.8 |
98 |
138.6 |
||
|
Total |
16031.0 |
103 |
Homework Answers
Add Answer to:
The table below shows an example of ANOVA table
results. Comparing educational outcomes across five different...
The following ANOVA table is from a study to compare the price of books in five...
 The following ANOVA table is from a study to compare the price of books in five different tres (Art Law, Medicine, Science, Technology) across three different years (2000, 2005, 2010). Complete the following ANOVA table, and use the results to perform the Two-Way ANOVA analysis for his experiment using a 5% significance level (@=0.05). Be sure to show all steps of all appropriate tests, ANALYSIS OF VARIANCE Sum of DF Squares Mean Square Value Subject 44.0961 110.7742 Subject Year 2.9140...
Looking at the sample provided, how would you interpret the results of the two-way ANOVA? What...
Looking at the sample provided, how would you interpret the results of the two-way ANOVA? What does the p value tell you? The results mention df. What does that term represent? How is it calculated? Write a plainly stated sentence that explains what these results tell you about your groups. ANOVA Sum of Squares df Mean Square F Sig. SCORES Between Groups 351.520 4 87.880 9.085 .000 Within Groups 435.300 45 9.673 Total 786.820 49
4. ANOVA calculations and rejection of the null hypothesis The following table summarizes the results of...
 4. ANOVA calculations and rejection of the null hypothesis The following table summarizes the results of a study on SAT prep courses, comparing SAT scores of students in a private preparation dlass, a high school preparation dlass, and no preparation dass. Use the information from the table to answer the remaining questions. Number of Observations Treatment Sample Mean Sum of Squares (SS) Private prep dlass 40 610 97,500.00 High school prep class 40 600 101,400.00 No prep class 40 590...
Imagine you are examining the effects of 3 doses of medication on migraines against a control....
Imagine you are examining the effects of 3 doses of medication on migraines against a control. You collected the data and ran the analyses. The incomplete ANOVA table below shows your preliminary results: Sum of Squares df Mean Square Between Groups 1346.63 3 755.87 Within Groups Total 5387.98 241 A) Complete the ANOVA table. B) How many participants were enrolled in the study? C) Calculate your F statistic and p value for the one-way ANOVA procedure, and interpret your results.
The following table shows the results of a repeated-measures analysis of variance comparing two treatment conditions...
The following table shows the results of a repeated-measures analysis of variance comparing two treatment conditions with a sample of n = 12 participants. Note that several values are missing in the table. Fill in the missing values in the ANOVA table. What is the missing value for SStotal? Source SS df MS Between __ __ 12 F = 4.00 Within __ __ Bet. Sub. 35 __ Error __ __ __ Total __ __
1. The following ANOVA summary table was obtained for a comparison of six teachers. Of interest...
1. The following ANOVA summary table was obtained for a comparison of six teachers. Of interest is whether students of those teachers display different mean levels of performance on a standardized language test. Class size is about 20 to 22 students per teacher, for a total number of 126 students included in the analysis. a. Complete the missing calculations in the table below. (0.5 points each; 3 points total) Sum of Squares df Mean Square F Between Groups 600.00 _____?...
The following table summarizes the results of a study on SAT prep courses, comparing SAT scores...
 The following table summarizes the results of a study on SAT prep courses, comparing SAT scores of students in a private preparation class, a high school preparation class, and no preparation class. Use the information from the table to answer the remaining questions Number of Sum of Treatment Private prep class High school prep class No prep class Observations Sample Mean Squares (SS) 690 680 640 60 60 60 265,500.00 276,120.00 302,670.00 Using the data provided, complete the partial ANOVA...
ANOVA A study is designed to examine whether there is a difference in mean daily calcium intake a...
 ANOVA
A study is designed to examine whether there is a difference in
mean daily calcium intake among three groups of adults with normal
bone density (Norm), adults with osteopenia (OstPNia) (a low bone
density which may lead to osteoporosis) and adults with
osteoporosis (OstPSis). A total of twenty-one adults at age 60 was
recruited in the study (7 adults in each group). Each participant's
daily calcium intake was measured based on reported food intake and
supplements in milligrams. We...
ANOVA
A study is designed to examine whether there is a difference in
mean daily calcium intake among three groups of adults with normal
bone density (Norm), adults with osteopenia (OstPNia) (a low bone
density which may lead to osteoporosis) and adults with
osteoporosis (OstPSis). A total of twenty-one adults at age 60 was
recruited in the study (7 adults in each group). Each participant's
daily calcium intake was measured based on reported food intake and
supplements in milligrams. We...
2. A drug company is comparing the results of three medications on the severity of bacillary...
 2. A drug company is comparing the results of three medications on the severity of bacillary dysentery in 15 Peace Corps volunteers returning to the US (N- 15). Below are the averages for these three groups. Placebo: xbar 11.74, n-5 Ciprofloxacin: xbar 3.64, n 5 Ofloxacin: xbar 3.48, n-5 a. State the null and alternative hypotheses. b. Conduct an ANOVA, showing all your work for each step, by completing the ANOVA table below. You need to show both the work...
In the Turkey paired comparisons. What treatment shows better outcomes? Support with data of the Tuckey...
 In
the Turkey paired comparisons. What treatment shows better
outcomes? Support with data of the Tuckey analyses.
inces Mailings Review View Help Acrobat E Title Tide Tele TITLE TIE GI EDIT A Colors Fonts ISO gt F sig Document Formatting Symptoms Improvement Indicator Sum of Squares df Between Groups 251.800 Within Groups 640.700 Total 892.500 Mean Square 62.950 4 4.421 004 45 14.238 49 0.004<0.01 Table 3 Dependent Variable: Symptoms Improvement Indicator Tukey HSD Mean Difference O Treatment (J) Treatment...
In
the Turkey paired comparisons. What treatment shows better
outcomes? Support with data of the Tuckey analyses.
inces Mailings Review View Help Acrobat E Title Tide Tele TITLE TIE GI EDIT A Colors Fonts ISO gt F sig Document Formatting Symptoms Improvement Indicator Sum of Squares df Between Groups 251.800 Within Groups 640.700 Total 892.500 Mean Square 62.950 4 4.421 004 45 14.238 49 0.004<0.01 Table 3 Dependent Variable: Symptoms Improvement Indicator Tukey HSD Mean Difference O Treatment (J) Treatment...
 The following ANOVA table is from a study to compare the price of books in five different tres (Art Law, Medicine, Science, Technology) across three different years (2000, 2005, 2010). Complete the following ANOVA table, and use the results to perform the Two-Way ANOVA analysis for his experiment using a 5% significance level (@=0.05). Be sure to show all steps of all appropriate tests, ANALYSIS OF VARIANCE Sum of DF Squares Mean Square Value Subject 44.0961 110.7742 Subject Year 2.9140...
 4. ANOVA calculations and rejection of the null hypothesis The following table summarizes the results of a study on SAT prep courses, comparing SAT scores of students in a private preparation dlass, a high school preparation dlass, and no preparation dass. Use the information from the table to answer the remaining questions. Number of Observations Treatment Sample Mean Sum of Squares (SS) Private prep dlass 40 610 97,500.00 High school prep class 40 600 101,400.00 No prep class 40 590...
 The following table summarizes the results of a study on SAT prep courses, comparing SAT scores of students in a private preparation class, a high school preparation class, and no preparation class. Use the information from the table to answer the remaining questions Number of Sum of Treatment Private prep class High school prep class No prep class Observations Sample Mean Squares (SS) 690 680 640 60 60 60 265,500.00 276,120.00 302,670.00 Using the data provided, complete the partial ANOVA...
 ANOVA
A study is designed to examine whether there is a difference in
mean daily calcium intake among three groups of adults with normal
bone density (Norm), adults with osteopenia (OstPNia) (a low bone
density which may lead to osteoporosis) and adults with
osteoporosis (OstPSis). A total of twenty-one adults at age 60 was
recruited in the study (7 adults in each group). Each participant's
daily calcium intake was measured based on reported food intake and
supplements in milligrams. We...
ANOVA
A study is designed to examine whether there is a difference in
mean daily calcium intake among three groups of adults with normal
bone density (Norm), adults with osteopenia (OstPNia) (a low bone
density which may lead to osteoporosis) and adults with
osteoporosis (OstPSis). A total of twenty-one adults at age 60 was
recruited in the study (7 adults in each group). Each participant's
daily calcium intake was measured based on reported food intake and
supplements in milligrams. We...
 2. A drug company is comparing the results of three medications on the severity of bacillary dysentery in 15 Peace Corps volunteers returning to the US (N- 15). Below are the averages for these three groups. Placebo: xbar 11.74, n-5 Ciprofloxacin: xbar 3.64, n 5 Ofloxacin: xbar 3.48, n-5 a. State the null and alternative hypotheses. b. Conduct an ANOVA, showing all your work for each step, by completing the ANOVA table below. You need to show both the work...
 In
the Turkey paired comparisons. What treatment shows better
outcomes? Support with data of the Tuckey analyses.
inces Mailings Review View Help Acrobat E Title Tide Tele TITLE TIE GI EDIT A Colors Fonts ISO gt F sig Document Formatting Symptoms Improvement Indicator Sum of Squares df Between Groups 251.800 Within Groups 640.700 Total 892.500 Mean Square 62.950 4 4.421 004 45 14.238 49 0.004<0.01 Table 3 Dependent Variable: Symptoms Improvement Indicator Tukey HSD Mean Difference O Treatment (J) Treatment...
In
the Turkey paired comparisons. What treatment shows better
outcomes? Support with data of the Tuckey analyses.
inces Mailings Review View Help Acrobat E Title Tide Tele TITLE TIE GI EDIT A Colors Fonts ISO gt F sig Document Formatting Symptoms Improvement Indicator Sum of Squares df Between Groups 251.800 Within Groups 640.700 Total 892.500 Mean Square 62.950 4 4.421 004 45 14.238 49 0.004<0.01 Table 3 Dependent Variable: Symptoms Improvement Indicator Tukey HSD Mean Difference O Treatment (J) Treatment...
Most questions answered within 3 hours.
-
A disabled tanker leaks kerosene (n = 1.20) into the
Persian Gulf, creating a large slick...
asked 1 minute ago -
5. Explain the condition for a DC motor to develop the
maximum power. If a DC...
asked 16 minutes ago -
Compute the p[Ag] after 35.00 mL of 0.1 M silver nitrate has been
added to the...
asked 19 minutes ago -
Walgreen Company (NYSE: WAG) is currently trading at $48.50 on
the NYSE. Walgreen Company is also...
asked 33 minutes ago -
Based on historical data, your team knows what proportion of the
company's orders come from Males...
asked 51 minutes ago -
8. Which of the following atoms has the largest magnitude
electron affinity?
(a) Sodium (Na)
(b)...
asked 53 minutes ago -
Assess the two types of tests of cognitive abilities. (
regarding HR course)
asked 58 minutes ago -
1.Write an inspiring vision statement for an organization where
you work or have worked. If the...
asked 59 minutes ago -
2. Is fair trade coffee sustainable for the mass market,
or is it a niche product...
asked 1 hour ago -
Please answer this asap in MATLAB.
In the following for loop, the the loop is executed...
asked 1 hour ago -
A 50.0-g golf ball is driven from the tee with an initial speed
of 44.6 m/s...
asked 1 hour ago -
Use the molar concentration of the 50 mL solution to calculate
the moles of Cr(III) in...
asked 1 hour ago