


Homework Answers
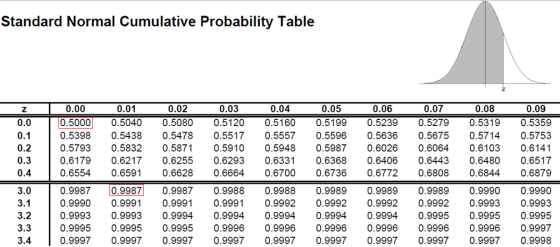
#5 By using standard normal table (shown below), the probability that z lies between 0 and 3.01 is:
--------------------------------------------------------------------------------------------
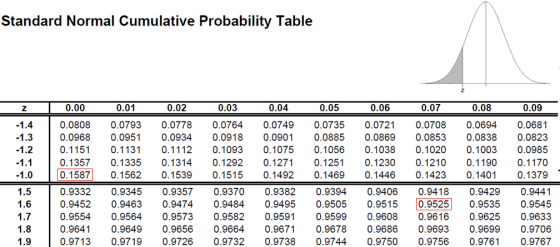
#6 Look into standard normal table (shown below) for area
closest to 0.4500, which is 0.4483. The z score corresponding to
this is -0.13. Therefore, we can say, z score corresponding to
P45 is .

--------------------------------------------------------------------------------------------
#8 By using standard normal table (shown below), the probability that September energy consumption level is between 1100 kWh and 1225 kWh is:

--------------------------------------------------------------------------------------------
#9 By using standard normal table (shown below), the probability that IQ score is between 85 and 125 is:
--------------------------------------------------------------------------------------------
#12 Since variance cannot be negative, the sample variance
values must be 0 or above. Therefore, the distribution of sample
variances must be
.
--------------------------------------------------------------------------------------------
#13 When small sample (less than 5% of the population) is taken
from the population, the samples maintain their independence.
Therefore, correct answer is
.
Add Answer to:
12. Provide an appropriate response. Samples of size n- 240 are randomly selected from the population...
normal probability distribution . Provide an appropriate response. (1 point) Samples of size n 15 are...
 normal probability distribution
. Provide an appropriate response. (1 point) Samples of size n 15 are randomly selected from the population of numbers (0 through 9) produced by a random-number generator, and the standard deviation is found for each sample. What is the distribution of the sample standard deviations? O normal (approximately) O skewed to the right O skewed to the left O not enough information provided 15. Provide an appropriate response. point) Samples of size n 90 are randomly...
normal probability distribution
. Provide an appropriate response. (1 point) Samples of size n 15 are randomly selected from the population of numbers (0 through 9) produced by a random-number generator, and the standard deviation is found for each sample. What is the distribution of the sample standard deviations? O normal (approximately) O skewed to the right O skewed to the left O not enough information provided 15. Provide an appropriate response. point) Samples of size n 90 are randomly...
bution =-1.75 6) The probability that lies between 1.10 and 0.3 D) 0.4951 mally distribut Provide...
 bution =-1.75 6) The probability that lies between 1.10 and 0.3 D) 0.4951 mally distribut Provide an appropriate response 7) Find the area of the shaded rion. The y distributed with a mean of 100 anda e d region. The graph s of adults, and those scores are of 100 and a standard deviation of 15s on the Wechsler test) A) 0.7436 B) 0.6293 C) 0.8051 D) 0.4100 8) Find the e area of the shaded region. The graph depicts...
25. Provide an appropriate response. Samples of size n-250 are randomly selected from the U.S. census...
 25. Provide an appropriate response. Samples of size n-250 are randomly selected from the U.S. census data, and the median income is found for each sample. What is the distribution of the sample medians? O skewed to the left O not enough information provided O normal (approximately O skewed to the right 26. Solve the problem. In a study of wait times at an amusement park, the most popular roller coaster has a mean wait time of 17.4 minutes with...
6) Provide an appropriate response. Round to the nearest hundredth 6) Find the standard deviation for...
 6) Provide an appropriate response. Round to the nearest hundredth 6) Find the standard deviation for the given probability distribution XP(x) 0 0.19 1 10.26 2 0.18 3 0.24 4 0.13 A) = 1.40 B) c = 1.76 C) = 1.33 D) 0 = 2.28 Find the mean, u, for the binomial distribution which has the stated values of nand p. Round answer to the nearest tenth. 7) n = 1599; p=0.57 A) u = 9057 B) 4 = 913.0...
probability, normal distribution
In one region, the September energy consumption levels for single-family homes are found to be normally distributed with a mean of 1050 kWh and a standard deviation of218 kWh. For a randomly selected home, find the probability that the September energy consumption level is between 1100 kWh and 1225 kWh.
1. Three randomly selected households are surveyed. The numbers of people in the households are 3, 4 and 11. Assume that samples of size n=2 are randomly selected with replacement from the populatio...
1. Three randomly selected households are surveyed. The numbers of people in the households are 3, 4 and 11. Assume that samples of size n=2 are randomly selected with replacement from the population of3, 4, and 11. Listed below are the nine different samples. Complete parts (a) through (c).3,3 3,4 3,11 4,3 4,4 4,11 11,3 11,4 11,11a. Find the variance of each of the nine samples, then summarize the sampling distribution of the variances in the format of a table...
If random samples of size n = 36 are drawn from a nonnormal population with finite...
 If random samples of size n = 36 are drawn from a nonnormal population with finite mean = 75 and standard deviation = 15, then the sampling distribution of the sample mean is approximately normally distributed with mean = 75 and standard deviation = 2.5. Select one: O a. False O b. True
in one region, the September energy consumption levels for single family homes are found to be...
 in one region, the September energy consumption levels for single family homes are found to be normally distributed with a mean of 1050 kwn and a standard deviation of 216 kwh For a randomly selected home, ind the probably that the September energy consumption level is between 1100 kWh and 1225 kWh Round to four decimal places O A. 0.1982 OB. 0 2881 OC. 03791 OD. 0.0910
Assume a population of 2, 4, and 9. Assume that samples of size n 2 are...
 Assume a population of 2, 4, and 9. Assume that samples of size n 2 are randomly selected with replacement from the population. Listed below are the nine different samples. Complete parts a through d below 4.9 9,9 2,2 2,4 2,9 4,4 9,2 9.4 a. Find the value of the population standard deviation σ (Round to three decimal places as needed.) b. Find the standard deviation of each of the nine samples, then summarize the sampling distribution of the standard...
Assume a population of 1, 4, and 10. Assume that samples of size n = 2...
 Assume a population of 1, 4, and 10. Assume that samples of size n = 2 are randomly selected with replacement from the population. Listed below are the nine different samples. Complete parts a through d below. 1,1 1,4 1,10 4,1 4,4 4,10 10,1 10,4 10,10 o a. Find the value of the population standard deviation o. (Round to three decimal places as needed.) b. Find the standard deviation of each of the nine samples, then summarize the sampling distribution...
 normal probability distribution
. Provide an appropriate response. (1 point) Samples of size n 15 are randomly selected from the population of numbers (0 through 9) produced by a random-number generator, and the standard deviation is found for each sample. What is the distribution of the sample standard deviations? O normal (approximately) O skewed to the right O skewed to the left O not enough information provided 15. Provide an appropriate response. point) Samples of size n 90 are randomly...
normal probability distribution
. Provide an appropriate response. (1 point) Samples of size n 15 are randomly selected from the population of numbers (0 through 9) produced by a random-number generator, and the standard deviation is found for each sample. What is the distribution of the sample standard deviations? O normal (approximately) O skewed to the right O skewed to the left O not enough information provided 15. Provide an appropriate response. point) Samples of size n 90 are randomly...
 bution =-1.75 6) The probability that lies between 1.10 and 0.3 D) 0.4951 mally distribut Provide an appropriate response 7) Find the area of the shaded rion. The y distributed with a mean of 100 anda e d region. The graph s of adults, and those scores are of 100 and a standard deviation of 15s on the Wechsler test) A) 0.7436 B) 0.6293 C) 0.8051 D) 0.4100 8) Find the e area of the shaded region. The graph depicts...
 25. Provide an appropriate response. Samples of size n-250 are randomly selected from the U.S. census data, and the median income is found for each sample. What is the distribution of the sample medians? O skewed to the left O not enough information provided O normal (approximately O skewed to the right 26. Solve the problem. In a study of wait times at an amusement park, the most popular roller coaster has a mean wait time of 17.4 minutes with...
 6) Provide an appropriate response. Round to the nearest hundredth 6) Find the standard deviation for the given probability distribution XP(x) 0 0.19 1 10.26 2 0.18 3 0.24 4 0.13 A) = 1.40 B) c = 1.76 C) = 1.33 D) 0 = 2.28 Find the mean, u, for the binomial distribution which has the stated values of nand p. Round answer to the nearest tenth. 7) n = 1599; p=0.57 A) u = 9057 B) 4 = 913.0...
 If random samples of size n = 36 are drawn from a nonnormal population with finite mean = 75 and standard deviation = 15, then the sampling distribution of the sample mean is approximately normally distributed with mean = 75 and standard deviation = 2.5. Select one: O a. False O b. True
 in one region, the September energy consumption levels for single family homes are found to be normally distributed with a mean of 1050 kwn and a standard deviation of 216 kwh For a randomly selected home, ind the probably that the September energy consumption level is between 1100 kWh and 1225 kWh Round to four decimal places O A. 0.1982 OB. 0 2881 OC. 03791 OD. 0.0910
 Assume a population of 2, 4, and 9. Assume that samples of size n 2 are randomly selected with replacement from the population. Listed below are the nine different samples. Complete parts a through d below 4.9 9,9 2,2 2,4 2,9 4,4 9,2 9.4 a. Find the value of the population standard deviation σ (Round to three decimal places as needed.) b. Find the standard deviation of each of the nine samples, then summarize the sampling distribution of the standard...
 Assume a population of 1, 4, and 10. Assume that samples of size n = 2 are randomly selected with replacement from the population. Listed below are the nine different samples. Complete parts a through d below. 1,1 1,4 1,10 4,1 4,4 4,10 10,1 10,4 10,10 o a. Find the value of the population standard deviation o. (Round to three decimal places as needed.) b. Find the standard deviation of each of the nine samples, then summarize the sampling distribution...
Most questions answered within 3 hours.
-
4. How many input & output Key Value Pairs are passed into,
and emitted out of...
asked 24 minutes ago -
B. If compound Y has approximately the same values of solubility
in toluene as compound X,...
asked 13 minutes ago -
Oscar Inc. has inventory in Japan valued at 39,051,000 Yen one
year ago. One year ago...
asked 20 minutes ago -
If Canada suffered from "fundamental disequilibrium," and its
government choose not to devalue its currency, a...
asked 28 minutes ago -
Why would your heart not function well if constructed of
skeletal muscle? What is the particular...
asked 32 minutes ago -
Please respond to this essay question in full essay form for
Chemistry 1102 Organic and Biochemistry:...
asked 33 minutes ago -
Determine the head loss and velocity of flow in a water supply main
of 15.0 cm...
asked 35 minutes ago -
A marketing executive who knowingly authorizes a shoddy
defective product to be brought to market is...
asked 43 minutes ago -
Write a psudocode:
1. Define a function called authorize that takes in 2 strings,
uName, and...
asked 48 minutes ago -
What Hall voltage (in mV) is produced by a 0.180 T field applied
across a 2.60...
asked 47 minutes ago -
What mass of ethylene glycol (C2H6O2) must be added to 211.0 g
of water to obtain...
asked 50 minutes ago -
Mary's employer has a defined benefits retirement plan, which
pay 3.2% of her last year's salary...
asked 53 minutes ago