
Homework Answers
1)
| team 1 | team 2 | |
| 72 | 67 | |
| 73 | 72 | |
| 76 | 76 | |
| 76 | 76 | |
| 78 | 84 | |
| mean | 75 | 75 |
| median | 76 | 76 |
| mode | 76 | 76 |
| range | 6 | 17 |
2)
these are statistic as they are summary for sample
3)
team 1 , sd = 2.449

team 2 sd = 6.245
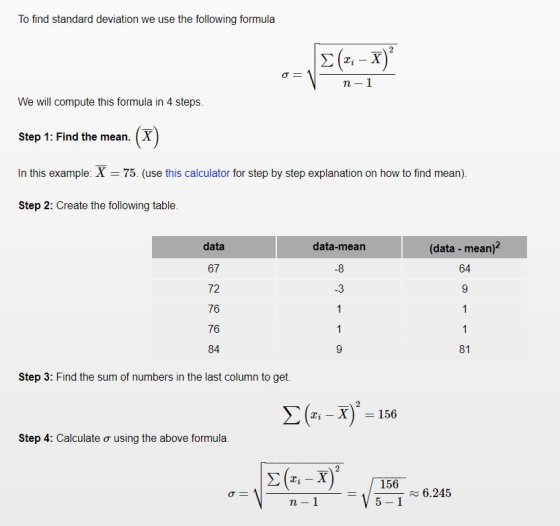
4)
team 2 player have more variation as their sd is more
Add Answer to:
Five starting basketball players were randomly selected from two teams. The heights, in inches, of five...
2. Five starting basketball players were randomly selected from two teams. The heights, in inches, of...
 2. Five starting basketball players were randomly selected from two teams. The heights, in inches, of five players on Team I are 72, 73, 76, 76, and 78; the heights of those on Team Il are 67, 72,76, 76 and 84, (please use the correct symbols in your answers, for example, x # orus#.) (1) Find the mean, median, mode and range of each team, respectively. (2) Are the four numbers you found in (1) statistics or parameters? (3) Calculate...
Question 4 15 pts Following are heights, in inches, for a sample of college basketball players....
 Question 4 15 pts Following are heights, in inches, for a sample of college basketball players. 84 88 78 85 70 75 72 86 78 81 86 78 81 72 73 76 77 87 88 60 a. Find the mean, median and mode. (3pts) b. Use the mean, median and mode to describe the shape of the distribution. (4pts) c. Find the standard deviation and variance of the heights of the basketball players. (4pts) d. Find the percentile for 85in,...
The table below shows the heights, in inches, of 15 randomly selected National Basketball Association (NBA)...
The table below shows the heights, in inches, of 15 randomly selected National Basketball Association (NBA) players and 15 randomly selected Division I National Collegiate Athletic Association (NCAA) players. NBA 84 77 80 76 81 81 77 85 78 79 78 79 84 75 77 NCAA 79 74 74 79 78 77 76 75 75 82 76 78 78 79 73 Using the same scale, draw a box-and-whisker plot for each of the two data sets, placing the second plot...
The data table contains frequency distribution of the heights of the players in a basketball league....
 The data table contains frequency distribution of the heights of the players in a basketball league. a. Calculate the mean and standard deviation of this population. b. What is the probability that a sample mean of 40 players will be less than 69.5 in.? c. What is the probability that a sample mean of 40 players will be more than 71 in.? d. What is the probability that a sample mean of 40 players will be between 70 and 71.5...
please answer these 3 questions thank you !! 1. 2. 3. es Question Help ome 2.3.101...
 please answer these 3 questions thank you !!
1.
2.
3.
es Question Help ome 2.3.101 The data to the right were obtained on the heights, in inches, of the players on the roster of a baseball team. a. Construct a stom-and-leaf diagram of these data with five lines per stem. b. Why is it better to use five lines per stem here instead of one or two lines per stem? ents 72 79 79 71 68 76 68 79...
please answer these 3 questions thank you !!
1.
2.
3.
es Question Help ome 2.3.101 The data to the right were obtained on the heights, in inches, of the players on the roster of a baseball team. a. Construct a stom-and-leaf diagram of these data with five lines per stem. b. Why is it better to use five lines per stem here instead of one or two lines per stem? ents 72 79 79 71 68 76 68 79...
Please r folder. Or import from another browser. Import favorites 114. Forty randomly selected students were...
 Please
r folder. Or import from another browser. Import favorites 114. Forty randomly selected students were asked the number of pairs of sneakers they owned. Let X the number of pairs of sneakers owned. The results are as follows: requency Relative Frequency Cumulative Relative Frequency 2 15 4 12 12 Table 2.81 a. Find the sample mean, i b Find the sample standard deviation, s c. Construct a histogram of the data. d. Complete the columns of the chart. e....
Please
r folder. Or import from another browser. Import favorites 114. Forty randomly selected students were asked the number of pairs of sneakers they owned. Let X the number of pairs of sneakers owned. The results are as follows: requency Relative Frequency Cumulative Relative Frequency 2 15 4 12 12 Table 2.81 a. Find the sample mean, i b Find the sample standard deviation, s c. Construct a histogram of the data. d. Complete the columns of the chart. e....
I literally have no idea what I’m doing. Help!!! Please show work!! Write an essay using...
 I literally have no idea what I’m doing. Help!!! Please show
work!!
Write an essay using Word and post it as an attachment to the discussion. Cover the following points. Choose a data set from Stat Disk using one of the following files from 13th Edition Elementary Statistics: Oscar Winner Freshman 15 Word Count Garbage Weights Passive and Active Smoke If the file contains more than one variable, choose a quantitative variable. Create a histogram using your chosen variable and...
I literally have no idea what I’m doing. Help!!! Please show
work!!
Write an essay using Word and post it as an attachment to the discussion. Cover the following points. Choose a data set from Stat Disk using one of the following files from 13th Edition Elementary Statistics: Oscar Winner Freshman 15 Word Count Garbage Weights Passive and Active Smoke If the file contains more than one variable, choose a quantitative variable. Create a histogram using your chosen variable and...
Here is a data set (n = 117) that has been sorted. 56.8 69.8 71.2 73.7...
 Here is a data set (n = 117) that has been sorted. 56.8 69.8 71.2 73.7 75.5 77. 4 78.7 80.3 81. 8 84. 5 87 88.6 92.4 59.9 70.4 72.2 74 75.6 77.5 78.7 80.5 8 2 85 87.1 88.6 92.7 61.2 70.4 72.3 74.1 75.9 77.7 78.7 80.8 82.2 85.3 87.6 88.9 92.8 62.2 68.4 70.5 70.6 72.4 72.5 74.2 74.3 76.1 76.2 77.8 77. 8 78.9 79.1 | 81 | 81.1 82.2 82.2 86.1 86.5 87.8 87.9...
i need help on question 3 to 22 please. Midterm ex review. MATH 101 Use the...
 i need help on question 3 to 22 please.
Midterm ex review. MATH 101 Use the following information to answer the next four exercises. The midterm grades on a chemistry exam, graded on a scale of 0 to 100, were: 62, 64, 65, 65, 68, 70, 72, 72, 74, 75, 75, 75, 76,78, 78, 81, 82, 83, 84, 85, 87, 88, 92, 95, 98, 98, 100, 100,740 1. Do you see any outliers in this data? If so, how would...
i need help on question 3 to 22 please.
Midterm ex review. MATH 101 Use the following information to answer the next four exercises. The midterm grades on a chemistry exam, graded on a scale of 0 to 100, were: 62, 64, 65, 65, 68, 70, 72, 72, 74, 75, 75, 75, 76,78, 78, 81, 82, 83, 84, 85, 87, 88, 92, 95, 98, 98, 100, 100,740 1. Do you see any outliers in this data? If so, how would...
 2. Five starting basketball players were randomly selected from two teams. The heights, in inches, of five players on Team I are 72, 73, 76, 76, and 78; the heights of those on Team Il are 67, 72,76, 76 and 84, (please use the correct symbols in your answers, for example, x # orus#.) (1) Find the mean, median, mode and range of each team, respectively. (2) Are the four numbers you found in (1) statistics or parameters? (3) Calculate...
 Question 4 15 pts Following are heights, in inches, for a sample of college basketball players. 84 88 78 85 70 75 72 86 78 81 86 78 81 72 73 76 77 87 88 60 a. Find the mean, median and mode. (3pts) b. Use the mean, median and mode to describe the shape of the distribution. (4pts) c. Find the standard deviation and variance of the heights of the basketball players. (4pts) d. Find the percentile for 85in,...
 The data table contains frequency distribution of the heights of the players in a basketball league. a. Calculate the mean and standard deviation of this population. b. What is the probability that a sample mean of 40 players will be less than 69.5 in.? c. What is the probability that a sample mean of 40 players will be more than 71 in.? d. What is the probability that a sample mean of 40 players will be between 70 and 71.5...
 please answer these 3 questions thank you !!
1.
2.
3.
es Question Help ome 2.3.101 The data to the right were obtained on the heights, in inches, of the players on the roster of a baseball team. a. Construct a stom-and-leaf diagram of these data with five lines per stem. b. Why is it better to use five lines per stem here instead of one or two lines per stem? ents 72 79 79 71 68 76 68 79...
please answer these 3 questions thank you !!
1.
2.
3.
es Question Help ome 2.3.101 The data to the right were obtained on the heights, in inches, of the players on the roster of a baseball team. a. Construct a stom-and-leaf diagram of these data with five lines per stem. b. Why is it better to use five lines per stem here instead of one or two lines per stem? ents 72 79 79 71 68 76 68 79...
 Please
r folder. Or import from another browser. Import favorites 114. Forty randomly selected students were asked the number of pairs of sneakers they owned. Let X the number of pairs of sneakers owned. The results are as follows: requency Relative Frequency Cumulative Relative Frequency 2 15 4 12 12 Table 2.81 a. Find the sample mean, i b Find the sample standard deviation, s c. Construct a histogram of the data. d. Complete the columns of the chart. e....
Please
r folder. Or import from another browser. Import favorites 114. Forty randomly selected students were asked the number of pairs of sneakers they owned. Let X the number of pairs of sneakers owned. The results are as follows: requency Relative Frequency Cumulative Relative Frequency 2 15 4 12 12 Table 2.81 a. Find the sample mean, i b Find the sample standard deviation, s c. Construct a histogram of the data. d. Complete the columns of the chart. e....
 I literally have no idea what I’m doing. Help!!! Please show
work!!
Write an essay using Word and post it as an attachment to the discussion. Cover the following points. Choose a data set from Stat Disk using one of the following files from 13th Edition Elementary Statistics: Oscar Winner Freshman 15 Word Count Garbage Weights Passive and Active Smoke If the file contains more than one variable, choose a quantitative variable. Create a histogram using your chosen variable and...
I literally have no idea what I’m doing. Help!!! Please show
work!!
Write an essay using Word and post it as an attachment to the discussion. Cover the following points. Choose a data set from Stat Disk using one of the following files from 13th Edition Elementary Statistics: Oscar Winner Freshman 15 Word Count Garbage Weights Passive and Active Smoke If the file contains more than one variable, choose a quantitative variable. Create a histogram using your chosen variable and...
 Here is a data set (n = 117) that has been sorted. 56.8 69.8 71.2 73.7 75.5 77. 4 78.7 80.3 81. 8 84. 5 87 88.6 92.4 59.9 70.4 72.2 74 75.6 77.5 78.7 80.5 8 2 85 87.1 88.6 92.7 61.2 70.4 72.3 74.1 75.9 77.7 78.7 80.8 82.2 85.3 87.6 88.9 92.8 62.2 68.4 70.5 70.6 72.4 72.5 74.2 74.3 76.1 76.2 77.8 77. 8 78.9 79.1 | 81 | 81.1 82.2 82.2 86.1 86.5 87.8 87.9...
 i need help on question 3 to 22 please.
Midterm ex review. MATH 101 Use the following information to answer the next four exercises. The midterm grades on a chemistry exam, graded on a scale of 0 to 100, were: 62, 64, 65, 65, 68, 70, 72, 72, 74, 75, 75, 75, 76,78, 78, 81, 82, 83, 84, 85, 87, 88, 92, 95, 98, 98, 100, 100,740 1. Do you see any outliers in this data? If so, how would...
i need help on question 3 to 22 please.
Midterm ex review. MATH 101 Use the following information to answer the next four exercises. The midterm grades on a chemistry exam, graded on a scale of 0 to 100, were: 62, 64, 65, 65, 68, 70, 72, 72, 74, 75, 75, 75, 76,78, 78, 81, 82, 83, 84, 85, 87, 88, 92, 95, 98, 98, 100, 100,740 1. Do you see any outliers in this data? If so, how would...
Most questions answered within 3 hours.
-
You are considering the purchase of a share of Edie's common
stock. You expect to sell...
asked 3 minutes ago -
Using the TI-84 calculator, find the area under the standard
normal curve that lies outside the...
asked 1 minute ago -
Assembly Programming
INCLUDE Irvine32.inc
Make a program that takes a string and a word as inputs...
asked 11 minutes ago -
Can I get a C++ code and output for this program using classes
instead of using...
asked 17 minutes ago -
A 4.0 L flask containing chlorine gas is connected to an
evacuated 3.0 L flask. If...
asked 27 minutes ago -
The number of years of education of self-employed individuals in
the United States has a population...
asked 14 minutes ago -
Write an essay containing your thoughts on
whether corporations should be limited in the amount of...
asked 28 minutes ago -
Given the following two sequences x (n)=[3 , 11,7 ,0 ,−1, 4 ,2
],−3≤n≤ 3 ;...
asked 28 minutes ago -
What is the minimal sample size needed for a 95% confidence
interval to have a maximal...
asked 29 minutes ago -
1. Methods of collecting data - Experiments and direct
observation
In each of the following situations,...
asked 43 minutes ago -
Each protein is composed of a maximum of ____________ different
amino acids in varying numbers and...
asked 1 hour ago -
One member in the comp set that did not have supply, demand, and
revenue data. What...
asked 38 minutes ago