

Homework Answers
Problem 1)
1) Yes we need to test the normality because population should be coming from normal distribution. This is assumption for the test.
2) The P value =0.60706 . The p value is very high in this case. It is greater than the level of significance. We fail to reject the null hypothesis. Hence, The given data is coming from normal distribution.
Test of normality satisfied .
3)We use large sample approximately T procedure
Add Answer to:
The FloridaLakes dataset describes characteristic of water samples taken at random Florida lakes. Acidity (pH) is...
The FloridaLakes dataset describes characteristic of water samples taken at random Florida lakes. Acidity (pH) is...
 The FloridaLakes dataset describes characteristic of water samples taken at random Florida lakes. Acidity (pH) is given for each lake. Pure water has a pH of 7, which is neutral. Solutions with a pH less than 7 are acidic while solutions with a pH greater than 7 are basic or alkaline. The researchers would like to know whether on average the solutions in Florida lakes are acidic. The following two problems are based on this dataset. Problem 2 This problem...
4. The FloridaLakes dataset describes characteristic of water samples taken at random Florida lakes. Acidity (pH) is given for each lake. Pure water has a pH of 7,which is neutral. with a pH les...
 4. The FloridaLakes dataset describes characteristic of water samples taken at random Florida lakes. Acidity (pH) is given for each lake. Pure water has a pH of 7,which is neutral. with a pH less than 7 are acidic while solutions with a pH greater than 7 are basic or alkaline. A rcher Jim Lee would like to know whether on average the solutions in Florlida lakes are acidic. In order to test whether on average the solutions in Florida lakes...
a) We perform the Shapi f this ro-Wilk normality test to gather more information. The output o Shapiro-Wilk W test for normal dataProb>Z test is given below variable Obs 53 0.98 0.88 0.270.61...
 a) We perform the Shapi f this ro-Wilk normality test to gather more information. The output o Shapiro-Wilk W test for normal dataProb>Z test is given below variable Obs 53 0.98 0.88 0.270.61 What is the p-value of this test? What is the conclusion? (3 credits) b) Assume that the distribution of the pH level is normal with ơ.1.20. Test H.: μ-7 versus H. : μ * 7 using a two-tailed test (significance level 0.01), (4 credits) Assume that the...
) Ul the residuals and achieve a Une &f the above. In a recent study, blood samples were taken on 20 participants before and after one week of drinking about five cups of tea a day. The befor...
 ) Ul the residuals and achieve a Une &f the above. In a recent study, blood samples were taken on 20 participants before and after one week of drinking about five cups of tea a day. The before and after samples for each participant were exposed to E.coli bacteria, and the production of interferon gamma (a molecule that fights bacteria, viruses and tumors) was recorded for the before and after samples for each participant. The researcher would like to know...
t est to gather oation. The outut of this What is the p-value of this test? What is the conclusion? (3 credins) Assume that the distribution of the pH Sevel is normal with ox1.20. Test 7 ui...
 t est to gather oation. The outut of this What is the p-value of this test? What is the conclusion? (3 credins) Assume that the distribution of the pH Sevel is normal with ox1.20. Test 7 uing a twotaled test (significance level 001). (4 creds) n.:μ " 7 verm / μ c) Assume that the distribution of the pH level is normal with σ120. Test p7 versus H:p <7 using a one-tailed test (significance level 0.01). (3 credits) As in...
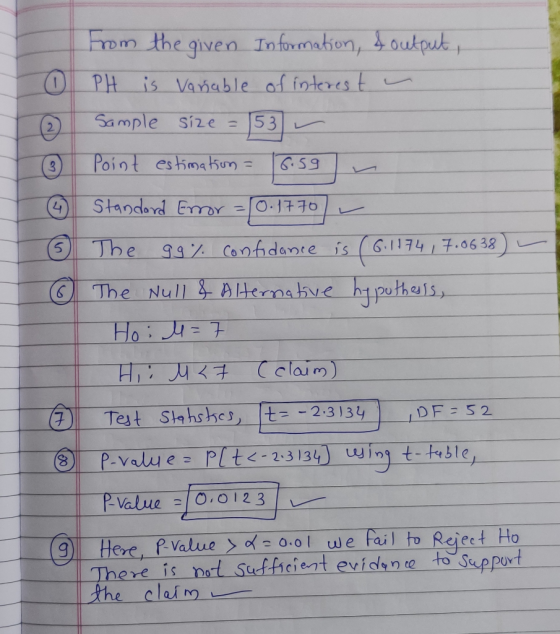
no 6 6. If we do not know σ=1.20 in the aforementioned problem 4, we will use a T-procedure to perform the hypothesis test. Below is the output: 1769821 1.288449 .117363 7.063763 53 6.390265 -2.31...
 no 6
6. If we do not know σ=1.20 in the aforementioned problem 4, we will use a T-procedure to perform the hypothesis test. Below is the output: 1769821 1.288449 .117363 7.063763 53 6.390265 -2.3134 52 degrees of freedon a) What is the sample mean of the 53 observed values? (2 credits If we perform a two-tailed test, what conclusion we can make based on the p value in the table above. (4 credits) b) If we perform a one-tailed...
no 6
6. If we do not know σ=1.20 in the aforementioned problem 4, we will use a T-procedure to perform the hypothesis test. Below is the output: 1769821 1.288449 .117363 7.063763 53 6.390265 -2.3134 52 degrees of freedon a) What is the sample mean of the 53 observed values? (2 credits If we perform a two-tailed test, what conclusion we can make based on the p value in the table above. (4 credits) b) If we perform a one-tailed...
2. [20 marks] Fresh water from rivers and lakes varies in acidity/alkalinity depending on the rocks and soils it runs over. Granite country yields water that is slightly acidic, while water from limes...
2. [20 marks] Fresh water from rivers and lakes varies in acidity/alkalinity depending on the rocks and soils it runs over. Granite country yields water that is slightly acidic, while water from limestone country is slightly alkaline. Acidity and alkalinity are measured on a pH scale, on which 7 is neutral, values below 7 are acidic and values above 7 are alkaline. pH can change due to pollution or due to waste from biomass such as algae. A certain river,...
A study was conducted to evaluate the effectiveness of a weight loss program. Among 36 obese indi...
 A study was conducted to evaluate the effectiveness of a weight loss program. Among 36 obese individuals aged 55 to 75 years randomly selected into the study, each individual had his/her BMI computed before and after the program. The decrease in the BMI was recorded into a SAS dataset and proc univariate was used to analyze this dataset. The population m ean of the decrease in the BMI is denoted by μ. Use the SAS output on the following page...
Let x be a random variable that represents the pH of arterial plasma (i.e., acidity of...
Let x be a random variable that represents the pH of arterial plasma (i.e., acidity of the blood). For healthy adults, the mean of the x distribution is μ = 7.4.† A new drug for arthritis has been developed. However, it is thought that this drug may change blood pH. A random sample of 36 patients with arthritis took the drug for 3 months. Blood tests showed that x = 8.7 with sample standard deviation s = 3.4. Use a...
Using the dataset that you used for the midterm (Find it on the Blackboard), do the following: 1) (4 points) Submit the values for items a to e in the table below: mean, sample size, standard deviatio...
Using the dataset that you used for the midterm (Find it on the Blackboard), do the following: 1) (4 points) Submit the values for items a to e in the table below: mean, sample size, standard deviation, and 95% confidence interval for mean. (SPSS Command: Analyze/Descriptive Statistics/Explore) Variable Statistic Height Mean 71.2 Sample Size N 999 Standard Deviation 2.913 95% Confidence Interval for Mean Lower Bound 71.02 Upper Bound 71.38 2) (4 points) Assume that you want to test whether...
 The FloridaLakes dataset describes characteristic of water samples taken at random Florida lakes. Acidity (pH) is given for each lake. Pure water has a pH of 7, which is neutral. Solutions with a pH less than 7 are acidic while solutions with a pH greater than 7 are basic or alkaline. The researchers would like to know whether on average the solutions in Florida lakes are acidic. The following two problems are based on this dataset. Problem 2 This problem...
 4. The FloridaLakes dataset describes characteristic of water samples taken at random Florida lakes. Acidity (pH) is given for each lake. Pure water has a pH of 7,which is neutral. with a pH less than 7 are acidic while solutions with a pH greater than 7 are basic or alkaline. A rcher Jim Lee would like to know whether on average the solutions in Florlida lakes are acidic. In order to test whether on average the solutions in Florida lakes...
 a) We perform the Shapi f this ro-Wilk normality test to gather more information. The output o Shapiro-Wilk W test for normal dataProb>Z test is given below variable Obs 53 0.98 0.88 0.270.61 What is the p-value of this test? What is the conclusion? (3 credits) b) Assume that the distribution of the pH level is normal with ơ.1.20. Test H.: μ-7 versus H. : μ * 7 using a two-tailed test (significance level 0.01), (4 credits) Assume that the...
 ) Ul the residuals and achieve a Une &f the above. In a recent study, blood samples were taken on 20 participants before and after one week of drinking about five cups of tea a day. The before and after samples for each participant were exposed to E.coli bacteria, and the production of interferon gamma (a molecule that fights bacteria, viruses and tumors) was recorded for the before and after samples for each participant. The researcher would like to know...
 t est to gather oation. The outut of this What is the p-value of this test? What is the conclusion? (3 credins) Assume that the distribution of the pH Sevel is normal with ox1.20. Test 7 uing a twotaled test (significance level 001). (4 creds) n.:μ " 7 verm / μ c) Assume that the distribution of the pH level is normal with σ120. Test p7 versus H:p <7 using a one-tailed test (significance level 0.01). (3 credits) As in...
 no 6
6. If we do not know σ=1.20 in the aforementioned problem 4, we will use a T-procedure to perform the hypothesis test. Below is the output: 1769821 1.288449 .117363 7.063763 53 6.390265 -2.3134 52 degrees of freedon a) What is the sample mean of the 53 observed values? (2 credits If we perform a two-tailed test, what conclusion we can make based on the p value in the table above. (4 credits) b) If we perform a one-tailed...
no 6
6. If we do not know σ=1.20 in the aforementioned problem 4, we will use a T-procedure to perform the hypothesis test. Below is the output: 1769821 1.288449 .117363 7.063763 53 6.390265 -2.3134 52 degrees of freedon a) What is the sample mean of the 53 observed values? (2 credits If we perform a two-tailed test, what conclusion we can make based on the p value in the table above. (4 credits) b) If we perform a one-tailed...
 A study was conducted to evaluate the effectiveness of a weight loss program. Among 36 obese individuals aged 55 to 75 years randomly selected into the study, each individual had his/her BMI computed before and after the program. The decrease in the BMI was recorded into a SAS dataset and proc univariate was used to analyze this dataset. The population m ean of the decrease in the BMI is denoted by μ. Use the SAS output on the following page...
Most questions answered within 3 hours.
-
An object in front of a concave mirror has a real image that is
11.5 cm...
asked 5 minutes ago -
Consider the reaction, C3 H8 + O2 --> CO2 + H2O. How many
moles of O2...
asked 1 hour ago -
You and your opponent both roll a fair die. If you both roll the
same number,...
asked 2 hours ago -
In a study of the accuracy of fast food drive-through orders,
Restaurant A had 257 accurate...
asked 2 hours ago -
Identify and describe in detail the four categories of
institutions that could be included in a...
asked 2 hours ago -
In python
class Customer:
def __init__(self, customer_id, last_name, first_name, phone_number, address):
self._customer_id = int(customer_id)
self._last_name =...
asked 2 hours ago -
What is an example of a limitation in implementing a new
ERP system and how it...
asked 2 hours ago -
In a section of 9.7cm of an artery with a radius of 2.6mm there
is a...
asked 2 hours ago -
the two carboxylic acid groups of aspartic acid have different
acidities with pKa values of 2.1...
asked 2 hours ago -
Would CuCO3 aqueous salt combined with calcium chloride
form a solid precipitate? If so, what would...
asked 2 hours ago -
How do ECM Solutions assist in embedding a culture of continuous
improvement in an organization? (Project...
asked 2 hours ago -
Directions
These directions introduce the idea of Essential Questions.
Since this may be a new concept...
asked 2 hours ago