

Please help with these questions. Will give thumbs up top rating! thank you
Homework Answers
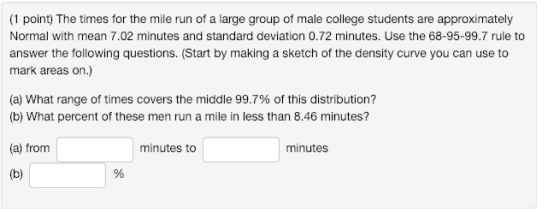
a)accordang to central limit theorem the middle of 99.7 % covers 3 standard deviations.
Hence from 7.02-0.72*3 to 7.02+0.72*3
= 4.86 to 9.18
b) at 8.46 the Standard deviation count is 8.46-7.02=1.44 /0.72=2
Since at 2 standard deviation in an normal distribution it covers 97.5 %.
Next part
Since the distribution of women height follows a normal distribution with mean =64 and standard deviation as 2.67 , hence as asked the what percentage of women follows more height than men mean height.
Mean height of men is 69.3 so bg using. Z statistics
Z at X= 69.3 is 1.985 calculated hence or 2 hence here according to central limit theorem 2.357% of women height are more than mean men height.
Again,
a) If SAT distribution follow a normal distribution with mean =533 and standard deviation as 116 hence by using Z statistic formula
Z=1.612 now calculating the are more than at Z =1.612 by Z table or by calculator as 0.0534 means 5.34% age of men having scores 720 or more than 720.
b. Again if women SAT scores follows normal distribution hence again by Z statistic formula
Z at 720 calculated as 2.009 or 2 hence by central limit theorem 2.227 % of women have 720 or better.
Add Answer to:
Please help with these questions. Will give thumbs up top
rating! thank you
(1 point) The...
(1 point) The heights of women aged 20 to 29 follow approximately the N(64, 2.68) distribution....
 (1 point) The heights of women aged 20 to 29 follow approximately the N(64, 2.68) distribution. Men the same age have heights distributed as N(69.3 2.69). What percent of young women are taller than the mean height of young men? (1 point) Changing the mean and standard deviation of a Normal distribution by a moderate amount can greatly change the percent of observation in the tails. Suppose that a college is looking for applicants with SAT math scores 750 and...
Please help with these questions. Will give thumbs up rating! Thank you! (1 point) Automated manufacturing...
 Please help with these questions. Will give thumbs up rating!
Thank you!
(1 point) Automated manufacturing operations are quite precise but still vary, often with distribution that are close to Normal. The width in inches of slots cut by a milling machine follows approximately the N(0.73, 0.0011) distribution. The specifications allow slot widths between 0.7298 and 0.7302. What proportion of slots meet these specifications? Answer as a percent: (1 point) A pharmaceutical manufacturer forms tablets by compressing a granular material...
Please help with these questions. Will give thumbs up rating!
Thank you!
(1 point) Automated manufacturing operations are quite precise but still vary, often with distribution that are close to Normal. The width in inches of slots cut by a milling machine follows approximately the N(0.73, 0.0011) distribution. The specifications allow slot widths between 0.7298 and 0.7302. What proportion of slots meet these specifications? Answer as a percent: (1 point) A pharmaceutical manufacturer forms tablets by compressing a granular material...
1.The heights of women aged 20 to 29 follow approximately the N(64, 2.57) distribution. Men the...
1.The heights of women aged 20 to 29 follow approximately the N(64, 2.57) distribution. Men the same age have heights distributed as N(69.3, 2.8). What percent of young men are shorter than the mean height of young women? 2. Changing the mean and standard deviation of a Normal distribution by a moderate amount can greatly change the percent of observation in the tails. Suppose that a college is looking for applicants with SAT math scores 760 and above. (a) In...
The heights of women aged 20 to 29 follow approximately the N(64, 2.76) distribution. Men the...
The heights of women aged 20 to 29 follow approximately the N(64, 2.76) distribution. Men the same age have heights distributed as N(69.3, 2.82). What percent of young men are shorter than the mean height of young women?
The heights of women aged 20 to 29 follow approximately the N(64, 2.81) distribution. Men the...
The heights of women aged 20 to 29 follow approximately the N(64, 2.81) distribution. Men the same age have heights distributed as N(69.3, 2.74). What percent of young women are taller than the mean height of young men? % please explain each step you take and how you got your solution . thank you
1.The heights of women aged 20 to 29 follow approximately the N(64, 2.76) distribution. Men the...
1.The heights of women aged 20 to 29 follow approximately the N(64, 2.76) distribution. Men the same age have heights distributed as N(69.3, 2.87). What percent of young women are taller than the mean height of young men? 2.The thorax lengths in a population of male fruit flies follow a Normal distribution with mean 0.785 millimeters (mm) and standard deviation 0.085 mm. What are the median and the first and third quartiles of thorax length? (a) Median: (b) The first...
(1 point) The heights of women aged 20 to 29 follow approximately the N(64.2.6 distribution. Men...
 (1 point) The heights of women aged 20 to 29 follow approximately the N(64.2.6 distribution. Men the same age have height distributed as N60.3, 2.95). What percent of young men are taller than the mean height of young women?
(1 point) Because of the relatively high interest rates, most consumers attempt to pay off their...
 (1 point) Because of the relatively high interest rates, most consumers attempt to pay off their credit card bills promptly. However, this is not always possible. An analysis of the amount of interest paid monthly by a bank's Visa cardholders reveals that the amount is normally distributed with a mean of 28 dollars and a standard deviation of 9 dollars. A. What proportion of the bank's Visa cardholders pay more than 32 dollars in interest? Proportion = B. What proportion...
(1 point) The summer monsoon rains in India follow approximately a Normal distribution with mean ...
 (1 point) The summer monsoon rains in India follow approximately a Normal distribution with mean 852 millimeters (mm) of rainfall and standard deviation 82 mm. Note: Use Table A to nnd the proportion or percentage below (a) In the drought year 1987, 697 mm of rain fell. In what percent of all years will India have 697 mm or less of monsoon rain? (b) "Normal rainfall. means within 20% or the long-term average, or between 683 mm and 1022 mm...
(1 point) The distribution of heights of adult men in the U.S. is approximately normal with mean 69 inches and standard deviation 2.5 inches Use what you know about a normal distribution and the...
 (1 point) The distribution of heights of adult men in the U.S. is approximately normal with mean 69 inches and standard deviation 2.5 inches Use what you know about a normal distribution and the 68-95-99.7 rule to answer the following NOTE: If your answer is a percent, such as 25 percent, enter: "25 PERCENT" (without the quotes). If your answer is in inches, such as 10 inches, enter: "10 INCHES" (without the quotes and with a space between the number...
 (1 point) The heights of women aged 20 to 29 follow approximately the N(64, 2.68) distribution. Men the same age have heights distributed as N(69.3 2.69). What percent of young women are taller than the mean height of young men? (1 point) Changing the mean and standard deviation of a Normal distribution by a moderate amount can greatly change the percent of observation in the tails. Suppose that a college is looking for applicants with SAT math scores 750 and...
 Please help with these questions. Will give thumbs up rating!
Thank you!
(1 point) Automated manufacturing operations are quite precise but still vary, often with distribution that are close to Normal. The width in inches of slots cut by a milling machine follows approximately the N(0.73, 0.0011) distribution. The specifications allow slot widths between 0.7298 and 0.7302. What proportion of slots meet these specifications? Answer as a percent: (1 point) A pharmaceutical manufacturer forms tablets by compressing a granular material...
Please help with these questions. Will give thumbs up rating!
Thank you!
(1 point) Automated manufacturing operations are quite precise but still vary, often with distribution that are close to Normal. The width in inches of slots cut by a milling machine follows approximately the N(0.73, 0.0011) distribution. The specifications allow slot widths between 0.7298 and 0.7302. What proportion of slots meet these specifications? Answer as a percent: (1 point) A pharmaceutical manufacturer forms tablets by compressing a granular material...
 (1 point) The heights of women aged 20 to 29 follow approximately the N(64.2.6 distribution. Men the same age have height distributed as N60.3, 2.95). What percent of young men are taller than the mean height of young women?
 (1 point) Because of the relatively high interest rates, most consumers attempt to pay off their credit card bills promptly. However, this is not always possible. An analysis of the amount of interest paid monthly by a bank's Visa cardholders reveals that the amount is normally distributed with a mean of 28 dollars and a standard deviation of 9 dollars. A. What proportion of the bank's Visa cardholders pay more than 32 dollars in interest? Proportion = B. What proportion...
 (1 point) The summer monsoon rains in India follow approximately a Normal distribution with mean 852 millimeters (mm) of rainfall and standard deviation 82 mm. Note: Use Table A to nnd the proportion or percentage below (a) In the drought year 1987, 697 mm of rain fell. In what percent of all years will India have 697 mm or less of monsoon rain? (b) "Normal rainfall. means within 20% or the long-term average, or between 683 mm and 1022 mm...
 (1 point) The distribution of heights of adult men in the U.S. is approximately normal with mean 69 inches and standard deviation 2.5 inches Use what you know about a normal distribution and the 68-95-99.7 rule to answer the following NOTE: If your answer is a percent, such as 25 percent, enter: "25 PERCENT" (without the quotes). If your answer is in inches, such as 10 inches, enter: "10 INCHES" (without the quotes and with a space between the number...
Most questions answered within 3 hours.
-
1. If a corporation purchases land and building and subsequently
tears down the building and uses...
asked 6 minutes ago -
Consider a 23-year bond with 7 percent annual coupon payments.
The market rate (YTM) is 6.4...
asked 9 minutes ago -
a tuba creates a 4th harmonic of frequency 116.5 Hz. what is the
frequency of the...
asked 15 minutes ago -
A coconut mass 2kg falls from a 30m tall tree. The coconut falls
and comes to...
asked 18 minutes ago -
Group Policies
Research GROUP POLICY OBJECTS (GPO'S)
You can start in the Windows Server 2012 eBook...
asked 22 minutes ago -
software engineering
Problems.
Create a use case diagram for class registration for a
university.
Create a...
asked 22 minutes ago -
You are trying to convince your friend who wants to attend
medical school to take BY123...
asked 37 minutes ago -
Subject: C++
I have created a class called QueueOfIntegers in a file called
QueueOfIntegers.h, which is...
asked 37 minutes ago -
calculate the number of molecules of gas in a
container of 2.0 liter at 30 degrees...
asked 54 minutes ago -
1.which of the following is a phototroph?
a. sulfolobus
b. chloroflexus
c. bacteroidetes
d. deinococcus radioduran...
asked 50 minutes ago -
The group of companies LC "High-precision measuring instruments"
is the global provider of measurement, analysis and...
asked 56 minutes ago -
I want to write a python function to find the minimum
I have an nested list:...
asked 56 minutes ago