The distribution above is
Given the following data set:
5.5 5.7 5.8 5.9 6.1 6.1 6.3 6.4 6.5 6.6
6.7 6.7 6.7 6.9 7.0 7.0 7.0 7.1 7.2 7.2
7.4 7.5 7.7 7.7 7.8 8.0 8.1 8.1 8.3 8.7
The distribution above is
a. Pareto
b. Left Skewed
c. Symmetric
d. Cannot be determined
e. Right Skewed
Homework Answers
Here we have data :
5.5,5.7,5.8,5.9,6.1,6.1,6.3,6.4,6.5,6.6,6.7,6.7,6.7,6.9,7,7,7,7.1,7.2,7.2,7.4,7.5,7.7,7.7,7.8,8,8.1,8.1,8.3,8.7
mean = 6.99
median = 7
median is grater than mean, its means data is left skewed.
its we can see through graph:
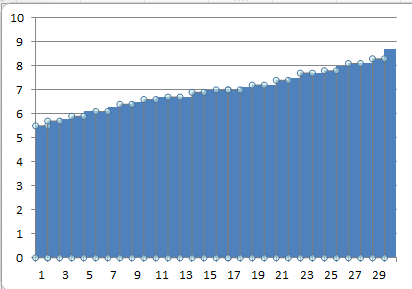
Correct option "B"
Left skewed
 The graph is accending in
nature to the right side .This type of graph is known as a pareto
graph.
The graph is accending in
nature to the right side .This type of graph is known as a pareto
graph.
Ans: (A) Pareto graph.
The data table contains waiting times of customers at a bank, where customers enter a single...
The data table contains waiting times of customers at a bank, where customers enter a single waiting line that feeds three teller windows. Test the claim that the standard deviation of waiting times is less than 2.4 minutes, which is the standard deviation of waiting times at the same bank when separate waiting lines are used at each teller window. Use a significance level of 0.01. Complete parts (a) through (d) below. Customer Waiting Times (in minutes) 7.5 6.5 9.2...
Customer Waiting Times (in minutes) 7.4 6.9 6.9 6.8 7.4 6.6 7.7 6.5 7.2 7.9 8.7...
 Customer Waiting Times (in minutes) 7.4 6.9 6.9 6.8 7.4 6.6 7.7 6.5 7.2 7.9 8.7 7.2 7.4 7.9 6.9 6.7 8.9 7.1 7.6 6.1 7.2 7.6 7.3 5.9 7.3 6.8 6.7 6.9 7.8 7.4 6.8 6.9 6.1 6.4 5.3 7.7 7.7 7.8 7.5 6.3 7.6 7.1 6.9 8.7 7.4 6.4 6.8 7.2 8.6 6.1 7.1 6.7 7.5 7.6 7.1 8.1 7.3 7.5 7.8 6.3 The accompanying data table includes weights (in grams) of a simple random sample of 40...
Parametirc test or not: Test statistic: p-value: decision: Is There A Difference Between the Means?
Parametirc test or not:Test statistic:p-value:decision:Is There A Difference Between the Means?6.7 6.2 3.1 310.3 10 5 5.56.9 5.5 3.3 3.110.5 6.3 4.3 5.44.5 4.6 1.8 25.6 5.6 2 2.65.9 6.1 2.1 2.58 11.7 4 4.68 7.4 3.3 3.15.8 5.2 3.1 2.96 7.3 3.0 3.28.7 5.3 2.7 36 5.5 2.1 2.27.2 6.3 3.5 3.25.9 4.6 2.9 3.46 7.4 3 3.37.2 7.8 3.7 3.48.6 9.4 5.1 5.77.2 8.1 2.8 3.15.8 5.4 2.2 1.83.3 4 1.7 1.86.8 5.1 2 1.83.7 3.5 2.2 2.112...
Question 3 of 10 (4 points) | Attempt 1 of 1 | View question in a...
 Question 3 of 10 (4 points) | Attempt 1 of 1 | View question in a popup | © 2h 55m Remaining 11.1 Section Exercise 16 (p-value, calc) ol. Baby weights: Following are weights in pounds for random samples of 17 newborn baby boys and baby girls born in Denver in 2011. Box plots indicate that the samples come from populations that are approximately normal. Let u, denote the mean weight of boys. Can you conclude that the mean weight...
47) The weights (in pounds) of a random sample of 32 new born babies, born at...
 47) The weights (in pounds) of a random sample of 32 new born babies, born at a particular 47) hospital are given below. Find the 95% confidence interval for the mean weight of the population of new born babies borm at this hospital. 7.5 6.4 7.1 7.1 6.8 8.6 74 6.4 74 7.0 6.0 7.8 9.0 7.3 6.5 5.8 8.4 7.6 7.2 6.5 8.5 7.1 6.3 6.9 7.0 5.9 8.3 6.6 73 77 6.4 8.2
The data on the below shows the number of hours a particular drug is in the...
The data on the below shows the number of hours a particular drug is in the system of 200 females. Develop a histogram of this data according to the following intervals: Follow the directions. Test the hypothesis that these data are distributed exponentially. Determine the test statistic. Round to two decimal places. (sort the data first) [0, 3) [3, 6) [6, 9) [9, 12) [12, 18) [18, 24) [24, infinity) 34.7 11.8 10 7.8 2.8 20 9.8 20.4 1.2 7.2...
QUESTION 1 Construct a boxplot for the given data. Include values of the 5-number summary in...
 QUESTION 1 Construct a boxplot for the given data. Include values of the 5-number summary in all boxplots The weights (in pounds) of 30 newborn babies are listed below. Construct a boxplot for the data set. 55.75.8 59 6.1 6.1 6.3 6.4 65 6.6 6.7 6.76.7 69 7.070707.1 7.272 4757.77.7 78 8.08.18.1 8.3 8.7 5.5 6.4 7.0 7.7 8.0 5.5 6.4 7.0 7.7 8.7 8.7 5.5 6.3 7.0 7.7 5.5 6.4 7.6 7.7 8.7 EPIC
4. A n experiment was set up to compare the effect of different soil pH and calcium additives on ...
 4. A n experiment was set up to compare the effect of different soil pH and calcium additives on the increase in trunk diameters for orange trees. Annual applications of elemental sulfur, gypsum, soda ash, and other ingredients were applied to provide pH value levels of 4, 5, 6, and 7. Three levels of a calcium supplement (100, 200, and 300 pounds per acre) were also applied. All factor-level combinations of these two variables were used in the experiment. At...
1. The numbers below represent heights (in feet) of 3-year old elm trees. 5.1, 5.5, 5.8,...
1. The numbers below represent heights (in feet) of 3-year old elm trees. 5.1, 5.5, 5.8, 6.1, 6.2, 6.4, 6.7, 6.8, 6.9, 7.0, 7.2, 7.3, 7.3, 7.4, 7.5, 7.7, 7.9, 8.1, 8.1, 8.2, 8.3, 8.5, 8.6, 8.6, 8.7, 8.7, 8.9, 8.9, 9.0, 9.1, 9.3, 9.4, 9.6, 9.8, 10.0, 10.2, 10.2 Using the chi-square goodness-of-fit test, determine whether the heights of 3-year old elm trees are normally distributed, at the a = .05 significance level. Also, find the p- value.
x: pH of Ground Water in 102 West Texas Wells 7.5 8.2 7.4 7.3 7.5 7.6...
x: pH of Ground Water in 102 West Texas Wells 7.5 8.2 7.4 7.3 7.5 7.6 7.9 7.7 7.8 7.0 7.6 7.9 7.7 8.2 7.4 7.6 7.4 7.6 7.2 7.1 7.3 7.2 7.4 7.5 7.9 8.2 7.4 7.2 7.5 7.2 7.3 7.0 7.2 7.3 7.3 7.2 7.3 7.0 8.4 7.7 7.6 7.7 7.5 7.8 7.2 7.6 8.1 7.9 7.4 8.1 8.6 7.3 8.2 7.7 8.0 7.0 8.2 7.1 7.5 8.2 7.2 7.9 8.5 7.2 7.1 7.0 7.8 7.3 7.3 7.4...
 Customer Waiting Times (in minutes) 7.4 6.9 6.9 6.8 7.4 6.6 7.7 6.5 7.2 7.9 8.7 7.2 7.4 7.9 6.9 6.7 8.9 7.1 7.6 6.1 7.2 7.6 7.3 5.9 7.3 6.8 6.7 6.9 7.8 7.4 6.8 6.9 6.1 6.4 5.3 7.7 7.7 7.8 7.5 6.3 7.6 7.1 6.9 8.7 7.4 6.4 6.8 7.2 8.6 6.1 7.1 6.7 7.5 7.6 7.1 8.1 7.3 7.5 7.8 6.3 The accompanying data table includes weights (in grams) of a simple random sample of 40...
 Question 3 of 10 (4 points) | Attempt 1 of 1 | View question in a popup | © 2h 55m Remaining 11.1 Section Exercise 16 (p-value, calc) ol. Baby weights: Following are weights in pounds for random samples of 17 newborn baby boys and baby girls born in Denver in 2011. Box plots indicate that the samples come from populations that are approximately normal. Let u, denote the mean weight of boys. Can you conclude that the mean weight...
 47) The weights (in pounds) of a random sample of 32 new born babies, born at a particular 47) hospital are given below. Find the 95% confidence interval for the mean weight of the population of new born babies borm at this hospital. 7.5 6.4 7.1 7.1 6.8 8.6 74 6.4 74 7.0 6.0 7.8 9.0 7.3 6.5 5.8 8.4 7.6 7.2 6.5 8.5 7.1 6.3 6.9 7.0 5.9 8.3 6.6 73 77 6.4 8.2
 QUESTION 1 Construct a boxplot for the given data. Include values of the 5-number summary in all boxplots The weights (in pounds) of 30 newborn babies are listed below. Construct a boxplot for the data set. 55.75.8 59 6.1 6.1 6.3 6.4 65 6.6 6.7 6.76.7 69 7.070707.1 7.272 4757.77.7 78 8.08.18.1 8.3 8.7 5.5 6.4 7.0 7.7 8.0 5.5 6.4 7.0 7.7 8.7 8.7 5.5 6.3 7.0 7.7 5.5 6.4 7.6 7.7 8.7 EPIC
 4. A n experiment was set up to compare the effect of different soil pH and calcium additives on the increase in trunk diameters for orange trees. Annual applications of elemental sulfur, gypsum, soda ash, and other ingredients were applied to provide pH value levels of 4, 5, 6, and 7. Three levels of a calcium supplement (100, 200, and 300 pounds per acre) were also applied. All factor-level combinations of these two variables were used in the experiment. At...
Most questions answered within 3 hours.
-
Two noble gases (Ne and He) are injected into the chambers of an
insulated container. Each...
asked 18 seconds from now -
Suppose you purchase a zero coupon bond with a face value of
$1,000, maturing in 18...
asked 4 minutes ago -
Explain how blackbody radiation led to the idea of "quanta."
Will rate answer!
asked 4 minutes ago -
Do you believe that the $785,000 amount at the center of the
Overstock-Grant Thornton dispute was...
asked 5 minutes ago -
Find and , the mean and standard deviation of the
sampling distribution of :
μ = 25,...
asked 29 minutes ago -
According to the manufacturer of a certain candy, 9% of the
candy produced are red. If...
asked 47 minutes ago -
A Eucher Deck consists of 24 cards. In a four- player game, each
player is dealt...
asked 1 hour ago -
This is a challenging question.
The titration of an impure sample of KHP found that 36.00...
asked 1 hour ago -
1. Starting from rest, an automatic subway train is controlled
by a computer
that causes it’s...
asked 29 minutes ago -
You place a block of
ice (mass of 3 kg) into a test chamber filled with...
asked 1 hour ago -
If a benzene ring has one -CF3 group as a
substituent, will the next substituent add...
asked 53 minutes ago -
CORPORATE FINANCE
STATEMENT: If the total risk of a stock is high you can
expect the...
asked 44 minutes ago