
Homework Answers
Given:

Pooled variance can be computed using the formula:
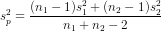
Substituting the values,

= 245.235
Hence, pooled variance = 245.235
The 99% CI for difference in means can be computed using the formula:

Substituting the values,

Where t0.05,51 can be obtained using the excel function:

We get t = 2.676
Hence,
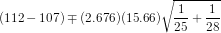
= 
= ( -6.53,16.53)
Hence, the 99% CI is given by ( -6.53,16.53)
Add Answer to:
this is not a true or false
4) In order to test the difference in populations...
ulations means, samples were collected for two independent populations where the 4) In order to test...
 ulations means, samples were collected for two independent populations where the 4) In order to test the difference in pop variances are assumed equal and the population normally distributed. The following data resulted. Find the value of the pooled variance ad 99% CI. Population1 x-112 opulation 2 = 107 14 n 25 n- 28
An analyst wants to test a hypothesis on the means of two populations. She takes samples...
An analyst wants to test a hypothesis on the means of two populations. She takes samples from each population. The variances of the population are not known, but are assumed to be equal. Statistics calculated from these samples are Sample 1 Average 1,053.6 Count 34 Sample 2 Average 1,079 Count 29 The pooled variance is calculated as 365.9 Based on this data calculate the t statistic to use in the hypothesis test. Enter your answer to 2 decimal places.
3. Test the indicated claim about the means of two populations. Assume that the two samples...
 3. Test the indicated claim about the means of two populations. Assume that the two samples are independent simple random samples selected from normally distributed populations. Do not assume that the population standard deviations are equal. Use the P-value method. A researcher wishes to determine whether people with high blood pressure can reduce their blood pressure, measured in mm Hg, by following a particular diet. Use a significance level of 0.01 to test the claim that the treatment group is...
Two samples each of size 20 are taken from independent populations assumed to be normally distributed...
 Two samples each of size 20 are taken from independent populations assumed to be normally distributed with equal variances. The first sample has a mean of 43.5 and a standard deviation of 4.1 while the second sample has a mean of 40.1 and a standard deviation of 3.2. A researcher would like to test if there is a difference between the population means at the 0.05 significance level. What can the researcher conclude? There is not sufficient evidence to reject...
Consider the following data from two independent samples with equal population variances. Construct a 99% confidence...
Consider the following data from two independent samples with equal population variances. Construct a 99% confidence interval to estimate the difference in population means. Assume the population variances are equal and that the populations are normally distributed. x overbar 1 equals= 37.1 x overbar 2 equals= 32.8 s 1 equals= 8.68 S2 equals= 9.59 N1 equals= 15 N2 equals= 16 The 99% confidence interval is ( )(. ).
are my answers correct? Consider the following data from two independent samples with equal population variances....
 are my answers
correct?
Consider the following data from two independent samples with equal population variances. Construct a 99% confidence interval to estimate the difference in population means. Assume the population variances are equal and that the populations are normally distributed x1 = 67.9 s1 = 12.8 n1 = 10 X2 74.8 s2 = 8.1 n2 = 14 Click here to see the t-distribution table, page 1 Click here to see the t-distribution table,_page 2 The 99% confidence interval is...
are my answers
correct?
Consider the following data from two independent samples with equal population variances. Construct a 99% confidence interval to estimate the difference in population means. Assume the population variances are equal and that the populations are normally distributed x1 = 67.9 s1 = 12.8 n1 = 10 X2 74.8 s2 = 8.1 n2 = 14 Click here to see the t-distribution table, page 1 Click here to see the t-distribution table,_page 2 The 99% confidence interval is...
10-66. Consider the following set of samples obtained from two normally distributed populations whose variances are...
 10-66. Consider the following set of samples obtained from two normally distributed populations whose variances are equal: Sample 1: 11.2 11.2 7.4 8.7 8.5 13.5 4.5 11.9 Sample 2: 11.7 9.5 15.6 16.5 11.3 17.6 17.0 8.5 a. Suppose that the samples were independent. Perform a test of hypothesis to determine if there is a difference in the two population means. Use a significance level of 0.05. MyStatLab b. Now suppose that the samples were paired samples. Perform a test...
The information below is based on independent random samples taken from two normally distributed populations having...
 The information below is based on independent random samples taken from two normally distributed populations having equal variances. Based on the sample information, determine the 95% confidence interval estimate for the difference between the two population means. n1 14 x145 n2 13 2 47 The 95% confidence interval is s (μ1-12) s Round to two decimal places as needed)
Given two independent random samples with the following results: n1=6x‾1=131s1=14n n2=11x‾2=109s2=10 Use this data to find...
Given two independent random samples with the following results: n1=6x‾1=131s1=14n n2=11x‾2=109s2=10 Use this data to find the 99%99% confidence interval for the true difference between the population means. Assume that the population variances are equal and that the two populations are normally distributed. Step 1 of 3 : Find the critical value that should be used in constructing the confidence interval. Round your answer to three decimal places.
For the independent-measures t test, which of the following describes the estimated standard error of M1 - M2 (whose sy...
 For the independent-measures t test, which of the following describes the estimated standard error of M1 - M2 (whose symbol is )? O The variance across all the data values when both samples are pooled together O A weighted average of the two sample variances (weighted by the sample sizes) O The difference between the standard deviations of the two samples O An estimate of the standard distance between the difference in sample means (M, - M2) and the difference...
 ulations means, samples were collected for two independent populations where the 4) In order to test the difference in pop variances are assumed equal and the population normally distributed. The following data resulted. Find the value of the pooled variance ad 99% CI. Population1 x-112 opulation 2 = 107 14 n 25 n- 28
 3. Test the indicated claim about the means of two populations. Assume that the two samples are independent simple random samples selected from normally distributed populations. Do not assume that the population standard deviations are equal. Use the P-value method. A researcher wishes to determine whether people with high blood pressure can reduce their blood pressure, measured in mm Hg, by following a particular diet. Use a significance level of 0.01 to test the claim that the treatment group is...
 Two samples each of size 20 are taken from independent populations assumed to be normally distributed with equal variances. The first sample has a mean of 43.5 and a standard deviation of 4.1 while the second sample has a mean of 40.1 and a standard deviation of 3.2. A researcher would like to test if there is a difference between the population means at the 0.05 significance level. What can the researcher conclude? There is not sufficient evidence to reject...
 are my answers
correct?
Consider the following data from two independent samples with equal population variances. Construct a 99% confidence interval to estimate the difference in population means. Assume the population variances are equal and that the populations are normally distributed x1 = 67.9 s1 = 12.8 n1 = 10 X2 74.8 s2 = 8.1 n2 = 14 Click here to see the t-distribution table, page 1 Click here to see the t-distribution table,_page 2 The 99% confidence interval is...
are my answers
correct?
Consider the following data from two independent samples with equal population variances. Construct a 99% confidence interval to estimate the difference in population means. Assume the population variances are equal and that the populations are normally distributed x1 = 67.9 s1 = 12.8 n1 = 10 X2 74.8 s2 = 8.1 n2 = 14 Click here to see the t-distribution table, page 1 Click here to see the t-distribution table,_page 2 The 99% confidence interval is...
 10-66. Consider the following set of samples obtained from two normally distributed populations whose variances are equal: Sample 1: 11.2 11.2 7.4 8.7 8.5 13.5 4.5 11.9 Sample 2: 11.7 9.5 15.6 16.5 11.3 17.6 17.0 8.5 a. Suppose that the samples were independent. Perform a test of hypothesis to determine if there is a difference in the two population means. Use a significance level of 0.05. MyStatLab b. Now suppose that the samples were paired samples. Perform a test...
 The information below is based on independent random samples taken from two normally distributed populations having equal variances. Based on the sample information, determine the 95% confidence interval estimate for the difference between the two population means. n1 14 x145 n2 13 2 47 The 95% confidence interval is s (μ1-12) s Round to two decimal places as needed)
 For the independent-measures t test, which of the following describes the estimated standard error of M1 - M2 (whose symbol is )? O The variance across all the data values when both samples are pooled together O A weighted average of the two sample variances (weighted by the sample sizes) O The difference between the standard deviations of the two samples O An estimate of the standard distance between the difference in sample means (M, - M2) and the difference...
Most questions answered within 3 hours.
-
The Problem: The Case of the Harmonizing Vacations
Your CEO is exploring partnering with a European...
asked 45 minutes ago -
A chemical equation is balanced by adding coefficients in front
of some formulas so that the...
asked 44 minutes ago -
From the literature (reference your sources): What are the
lattice parameters of calcite and aragonite? Why...
asked 1 hour ago -
Your system is rejecting the question am asking which is
preceded by a case study. It...
asked 1 hour ago -
3. On January 2, 2000, Larry creates a trust with himself as
trustee. Larry as trustee...
asked 1 hour ago -
A member of the volleyball team spikes the ball. During this
process, she changes the velocity...
asked 1 hour ago -
Are adult gamers less likely to use a gaming console (Xbox,
PlayStation, Wii, etc...) than teen...
asked 2 hours ago -
The University of
Texas recently reported that 43% of college students aged 18-24
would spend their...
asked 2 hours ago -
The length of stay at a specific emergency department in
Phoenix, Arizona, in 2009 had a...
asked 1 hour ago -
. Please give the mechanism for this type of problem. Step by
Step
The toxin that...
asked 1 hour ago -
If you have a 1M stock solution and you want to dilute 1 :10
with water,...
asked 1 hour ago -
In a load instruction, the effective address is obtained by
A) Retriving the address from a...
asked 1 hour ago