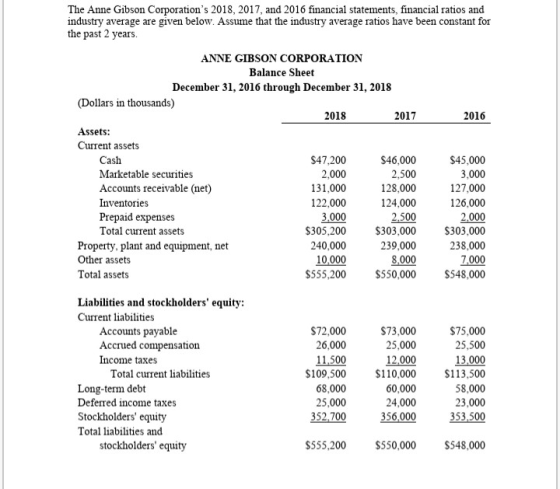
ANNE GIBSON CORPORATION
Balance Sheet
December 31, 2016 through December 31, 2018 (Dollars in
thousands)
2018 2017 2016
Assets:
Current assets
Cash $47,200 $46,000 $45,000
Marketable securities 2,000 2,500 3,000
Accounts receivable (net) 131,000 128,000 127,000
Inventories 122,000 124,000 126,000
Prepaid expenses 3,000 2,500 2,000
Total current assets $305,200 $303,000 $303,000
Property, plant and equipment, net 240,000 239,000 238,000
Other assets 10,000 8,000 7,000
Total assets $555,200 $550,000 $548,000
Liabilities and stockholders' equity:
Current liabilities
Accounts payable $72,000 $73,000 $75,000
Accrued compensation 26,000 25,000 25,500
Income taxes 11,500 12,000 13,000
Total current liabilities $109,500 $110,000 $113,500
Long-term debt 68,000 60,000 58,000
Deferred income taxes 25,000 24,000 23,000
Stockholders' equity 352,700 356,000 353,500
Total liabilities &
stockholders' equity $555,200 $550,000 $548,000
ANNE GIBSON CORPORATION
Statement of Earnings
For Years Ended December 31, 2016-2018
(In thousands)
2018 2017 2016
Net sales $880,000 $910,000 $840,000
Cost of goods sold 740,000 760,000 704,000
Gross profit $140,000 $150,000 $136,000
Selling and administrative expense 53,000 52,000 50,000
Interest expense 6,700 5,900 5,800
Earnings from continuing
operations before income taxes $80,300 $92,100 $80,200
Income taxes 26,000 27,500 28,000
Net earnings $54,300 $64,600 $52,200
Anne Gibson Corp.
Industry Ratios
Ratios Unit 2018 2017 2016
Liquidity:
Current ratio times 2.79 2.75 2.67 2.5
Acid-test ratio times 1.65 1.60 1.54 1.5
Asset Management:
Accounts receivable turnover Times per year 6.80 7.14 6.64
10.42
Accounts receivable turnover in days Days 53.71 51.14 54.97
35.03
Inventory turnover Times per year 6.02 6.08 5.57 5.5
Inventory turnover in days Days 60.67 60.03 65.59 66.37
Total asset turnover Times per year 1.59 1.66 1.54 1.65
Long-term debt-paying ability:
Times interest earned Times per year 12.99 16.61 14.83 10.55
Debt ratio % 36.47 35.27 35.49 52.6
Profitability:
Profit Margin % 6.17 7.10 6.21 7.05
Returns on assets % 9.83 11.77 9.55 10.5
Returns on equity % 15.32 18.21 14.87 16.5
Analyze each ratio in liquidity and assess Anne Gibson’s liquidity position and explain how it compares with industry average.
Analyze each ratio in assets management and assess Anne Gibson’s assets management position and explain how it compares with industry average.
Analyze each ratio insolvency and assess Anne Gibson’s debt management position and explain how it compares with the industry average..


Homework Answers
Solution:
Part A )
Liquidity ratio
Current ratio: Current ratio = Current assets / Current liability.
The current ratio of the firm (2.67 to 2.79) is better than the industry average (2.5) and it means that the firm is more liquid than the industry
Acid test ratio = (Current assets - Inventory) / Current liability
The acid test ratio of the firm (1.54 to 1.65) is better than the industry average (1.5) and it means that the firm is more liquid than the industry as the firm has more liquid assets.
Part B )
Asset management ratio
AR turnover and AR turnover days
AR turnover = Credit sales / AR receivable , AR turnover days = 365 / AR turnover
It is evident that the AR turnover is lower than the industry average and AR days are higher than industry average. It means that the firm is less efficient than the industry as they collect cash in 51-54 days for the sales that were made in credit as compared to the industry average of 35 days
Inventory turnover and inventory turnover days
Inventory turnover = COGS / Inventory , Inventory turnover days = 365 / Inventory turnover
It is evident that the invenory turnover is slighttly higher than the industry average and Inventory turnover days are slightly lower than industry average. It means that the firm is slightly more efficient than the industry as they keep inventory for 60-65 days as compared to industry average of 66 days.
Total Asset turnover = Sales / Total assets
This ratio is almost similar to the industry average means that the firm is generating sales per total assets in similar way as the industry.
Part C )
Solvency ratio:
Times interest earned = EBIT / Interest
This ratio is higher than the industry average that means that the firm is generating higher operating profits as compared to the interest payment.
Debt ratio = Debt / Total Assets
This ratio is lower than the industry average and it means that the firm has lower debt and solvency is better.
Part D )
Profitability ratio:
Profit margin = Net Income / Sales
Return on assets = Net income / Assets
Return on Equity = Net Income / Equity
These all three ratio is similar than the industry average hence it means that the firm is generating similar profit as compared to the industry.
Add Answer to:
ANNE GIBSON CORPORATION
Balance Sheet
December 31, 2016 through December 31, 2018 (Dollars in
thousands)
2018...
(CMA Adapted) 0-25 Consecutive five-year balance sheets and income statements of Anne Gibson Corpo- ration follow:...
 (CMA Adapted) 0-25 Consecutive five-year balance sheets and income statements of Anne Gibson Corpo- ration follow: 2007 $ 43,000 3,000 ANNE GIBSON CORPORATION Balance Sheet December 31, 2007 through December 31, 2011 (Dollars in thousands) 2011 2010 2009 2008 Assets: Current assets Cash $ 47,200 $ 46,000 $ 45,000 $ 44,000 Marketable securities 2,000 2,500 3,000 3,000 Accounts receivable, less allowance of $1,000, December 31, 2011; $900, December 31, 2010; $900, December 31, 2009; $800, December 31, 2008; $1,200, December...
2020 Question #3 Springhill Corporation Balance Sheet December 31, 2021, and December 31", 2020 (in thousands)...
 2020 Question #3 Springhill Corporation Balance Sheet December 31, 2021, and December 31", 2020 (in thousands) 2021 Assets Current Assets: Cash $90,000 Accounts Receivable 60,000 Inventory 18,000 Prepaid Expenses 2,000 Total Current Assets 170,000 Capital Assets (PP&E) 50,000 Total Assets $220,000 $57,000 40,000 10,000 1,000 108,000 30,000 $138,000 Liabilities: Accounts Payable Accrued Liabilities Income Taxes Payable Total Current Liabilities Long Term Debt Total liabilities $11,000 6,000 5,000 22,000 40,000 362,000 $4,000 3,000 8,000 15,000 8,000 S23,000 Shareholders' Equity Common Shares...
Barry Computer Company: Balance Sheet as of December 31, 2018 (In Thousands) Cash $167,440 Accounts payable...
 Barry Computer Company: Balance Sheet as of December 31, 2018 (In Thousands) Cash $167,440 Accounts payable $191,360 Receivables 382,720 Other current liabilities 179,400 Inventories 299,000 Notes payable to bank 119,600 Total current assets $849,160 Total current liabilities $490,360 $251,160 Long-term debt Common equity (45,448 Net fixed assets 346,840 454,480 Total assets $1,196,000 Total liabilities and equity $1,196,000 Barry Computer Company: Income Statement for Year Ended December 31, 2018 (In Thousands) Sales $2,300,000 Cost of goods sold Materials Labor $1,035,000 483,000...
Zandi's Technologies: December 31 Balance Sheets (Thousands of Dollars) Assets Cash and cash equivalents Short-term investments...
 Zandi's Technologies: December 31 Balance Sheets (Thousands of Dollars) Assets Cash and cash equivalents Short-term investments Accounts Receivable Inventories Total current assets Net fixed assets Total assets 2018 $21,000 3.759 52 500 84.000 $161,259 218.400 $379,659 2017 $20,000 3,240 48.000 56.000 $127,240 200.000 $327,240 2016 $21,053 $3,411 $50.526 $58,947 $133,937 200.000 $333,937 Liabilities and equity Accounts payable Accruals Notes payable Total current liabilities Long-term debt Total liabilities Common stock Retained Earnings Total common equity Total liabilities and equity $33,600 12,600...
Question 1 Income Statement Paper and Board Berhad For the Year Ended December 31, 2016 RM...
 Question 1 Income Statement Paper and Board Berhad For the Year Ended December 31, 2016 RM Sales 2,080,976 (-) Cost of Goods Sold 1,701,000 Gross Profits 379,976 (-) Operating Expenses 273,846 Operating Profits 106,130 (-) Interest 19,296 Net Profit before taxes 86,834 (-) Taxes 34,734 Net Profit after taxes 52,100 Balance Sheet Paper and Board Berhad December 31, 2016 Assets Cash Accounts receivable Inventories Total Current Assets Gross fixed assets (-) Accumulated Depreciation Net Fixed Assets Total Assets RM 95,000...
2020 Question #3 Springhill Corporation Balance Sheet December 31, 2021, and December 31", 2020 (in thousands)...
 2020 Question #3 Springhill Corporation Balance Sheet December 31, 2021, and December 31", 2020 (in thousands) 2021 Assets Current Assets: Cash $90,000 Accounts Receivable 60,000 Inventory 18,000 Prepaid Expenses 2,000 Total Current Assets 170,000 Capital Assets (PP&E) 50,000 Total Assets $220,000 $57,000 40,000 10,000 1,000 108,000 30,000 $138,000 Liabilities: Accounts Payable Accrued Liabilities Income Taxes Payable Total Current Liabilities Long Term Debt Total liabilities $11,000 6,000 5,000 22,000 40,000 362,000 $4,000 3,000 8,000 15,000 8,000 S23,000 Shareholders' Equity Common Shares...
FIN Company: Balance Sheet as of December 31 ($ million) $40 Cash Account receivables Inventories Total...
 FIN Company: Balance Sheet as of December 31 ($ million) $40 Cash Account receivables Inventories Total current assets $40 $20 $100 $40 Account Payables ? Notes payable $160 Other current liabilities $310 Total current liabilities Long-term debt Total liabilities Common stock Retained earnings Total stockholders' equity $450 Total liabilities and equity $140 $114 ? Net fixed assets Total assets FIN Company: Income Statement for Year Ended December 31 ($ million) $800.0 Net sales Cost of goods sold (80% of net...
the Answer is Not 102700-179800= -77100 2016 ELKHARDT CORPORATION Statement of Financial Position December 31 2018...
 the Answer is Not 102700-179800= -77100
2016 ELKHARDT CORPORATION Statement of Financial Position December 31 2018 2017 Assets Current assets Cash $25,000 $19,900 Accounts receivable (net) 54,800 44,600 Inventory 100,000 85,200 Total current assets 179,800 149,700 Long-term investments 50,000 69,200 Property, plant, and equipment (net) 503,300 370,900 Total assets $733,100 $589,800 Liabilities and Shareholders' Equity Liabilities Current liabilities $84,100 $80,000 Non-current liabilities 154,200 84,400 Total liabilities 238,300 164,400 Shareholders' equity Common shares 331,400 300,200 Retained earnings 163,400 125,200 Total shareholders'...
the Answer is Not 102700-179800= -77100
2016 ELKHARDT CORPORATION Statement of Financial Position December 31 2018 2017 Assets Current assets Cash $25,000 $19,900 Accounts receivable (net) 54,800 44,600 Inventory 100,000 85,200 Total current assets 179,800 149,700 Long-term investments 50,000 69,200 Property, plant, and equipment (net) 503,300 370,900 Total assets $733,100 $589,800 Liabilities and Shareholders' Equity Liabilities Current liabilities $84,100 $80,000 Non-current liabilities 154,200 84,400 Total liabilities 238,300 164,400 Shareholders' equity Common shares 331,400 300,200 Retained earnings 163,400 125,200 Total shareholders'...
Data for Barry Computer Co. and its industry averages follow Barry Computer Company: Balance Sheet as of December 31, 2...
 Data for Barry Computer Co. and its industry averages follow Barry Computer Company: Balance Sheet as of December 31, 2016 (In Thousands) Accounts payable Cash $174,960 $160,380 Receivables Other current liabilities 174,960 510,300 Inventories 393,660 Notes payable to bank 116,640 Total current assets $1,078,920 Total current liabilities $451,980 Long-term debt $335,340 Net fixed assets 379,080 Common equity 670,680 Total assets $1,458,000 Total liabilities and equity $1,458,000 Barry Computer Company: Income Statement for Year Ended December 31, 2016 (In Thousands) Sales...
 (CMA Adapted) 0-25 Consecutive five-year balance sheets and income statements of Anne Gibson Corpo- ration follow: 2007 $ 43,000 3,000 ANNE GIBSON CORPORATION Balance Sheet December 31, 2007 through December 31, 2011 (Dollars in thousands) 2011 2010 2009 2008 Assets: Current assets Cash $ 47,200 $ 46,000 $ 45,000 $ 44,000 Marketable securities 2,000 2,500 3,000 3,000 Accounts receivable, less allowance of $1,000, December 31, 2011; $900, December 31, 2010; $900, December 31, 2009; $800, December 31, 2008; $1,200, December...
 2020 Question #3 Springhill Corporation Balance Sheet December 31, 2021, and December 31", 2020 (in thousands) 2021 Assets Current Assets: Cash $90,000 Accounts Receivable 60,000 Inventory 18,000 Prepaid Expenses 2,000 Total Current Assets 170,000 Capital Assets (PP&E) 50,000 Total Assets $220,000 $57,000 40,000 10,000 1,000 108,000 30,000 $138,000 Liabilities: Accounts Payable Accrued Liabilities Income Taxes Payable Total Current Liabilities Long Term Debt Total liabilities $11,000 6,000 5,000 22,000 40,000 362,000 $4,000 3,000 8,000 15,000 8,000 S23,000 Shareholders' Equity Common Shares...
 Barry Computer Company: Balance Sheet as of December 31, 2018 (In Thousands) Cash $167,440 Accounts payable $191,360 Receivables 382,720 Other current liabilities 179,400 Inventories 299,000 Notes payable to bank 119,600 Total current assets $849,160 Total current liabilities $490,360 $251,160 Long-term debt Common equity (45,448 Net fixed assets 346,840 454,480 Total assets $1,196,000 Total liabilities and equity $1,196,000 Barry Computer Company: Income Statement for Year Ended December 31, 2018 (In Thousands) Sales $2,300,000 Cost of goods sold Materials Labor $1,035,000 483,000...
 Zandi's Technologies: December 31 Balance Sheets (Thousands of Dollars) Assets Cash and cash equivalents Short-term investments Accounts Receivable Inventories Total current assets Net fixed assets Total assets 2018 $21,000 3.759 52 500 84.000 $161,259 218.400 $379,659 2017 $20,000 3,240 48.000 56.000 $127,240 200.000 $327,240 2016 $21,053 $3,411 $50.526 $58,947 $133,937 200.000 $333,937 Liabilities and equity Accounts payable Accruals Notes payable Total current liabilities Long-term debt Total liabilities Common stock Retained Earnings Total common equity Total liabilities and equity $33,600 12,600...
 Question 1 Income Statement Paper and Board Berhad For the Year Ended December 31, 2016 RM Sales 2,080,976 (-) Cost of Goods Sold 1,701,000 Gross Profits 379,976 (-) Operating Expenses 273,846 Operating Profits 106,130 (-) Interest 19,296 Net Profit before taxes 86,834 (-) Taxes 34,734 Net Profit after taxes 52,100 Balance Sheet Paper and Board Berhad December 31, 2016 Assets Cash Accounts receivable Inventories Total Current Assets Gross fixed assets (-) Accumulated Depreciation Net Fixed Assets Total Assets RM 95,000...
 2020 Question #3 Springhill Corporation Balance Sheet December 31, 2021, and December 31", 2020 (in thousands) 2021 Assets Current Assets: Cash $90,000 Accounts Receivable 60,000 Inventory 18,000 Prepaid Expenses 2,000 Total Current Assets 170,000 Capital Assets (PP&E) 50,000 Total Assets $220,000 $57,000 40,000 10,000 1,000 108,000 30,000 $138,000 Liabilities: Accounts Payable Accrued Liabilities Income Taxes Payable Total Current Liabilities Long Term Debt Total liabilities $11,000 6,000 5,000 22,000 40,000 362,000 $4,000 3,000 8,000 15,000 8,000 S23,000 Shareholders' Equity Common Shares...
 2020 Question #3 Springhill Corporation Balance Sheet December 31, 2021, and December 31", 2020 (in thousands) 2021 Assets Current Assets: Cash $90,000 Accounts Receivable 60,000 Inventory 18,000 Prepaid Expenses 2,000 Total Current Assets 170,000 Capital Assets (PP&E) 50,000 Total Assets $220,000 $57,000 40,000 10,000 1,000 108,000 30,000 $138,000 Liabilities: Accounts Payable Accrued Liabilities Income Taxes Payable Total Current Liabilities Long Term Debt Total liabilities $11,000 6,000 5,000 22,000 40,000 362,000 $4,000 3,000 8,000 15,000 8,000 S23,000 Shareholders' Equity Common Shares...
 FIN Company: Balance Sheet as of December 31 ($ million) $40 Cash Account receivables Inventories Total current assets $40 $20 $100 $40 Account Payables ? Notes payable $160 Other current liabilities $310 Total current liabilities Long-term debt Total liabilities Common stock Retained earnings Total stockholders' equity $450 Total liabilities and equity $140 $114 ? Net fixed assets Total assets FIN Company: Income Statement for Year Ended December 31 ($ million) $800.0 Net sales Cost of goods sold (80% of net...
 the Answer is Not 102700-179800= -77100
2016 ELKHARDT CORPORATION Statement of Financial Position December 31 2018 2017 Assets Current assets Cash $25,000 $19,900 Accounts receivable (net) 54,800 44,600 Inventory 100,000 85,200 Total current assets 179,800 149,700 Long-term investments 50,000 69,200 Property, plant, and equipment (net) 503,300 370,900 Total assets $733,100 $589,800 Liabilities and Shareholders' Equity Liabilities Current liabilities $84,100 $80,000 Non-current liabilities 154,200 84,400 Total liabilities 238,300 164,400 Shareholders' equity Common shares 331,400 300,200 Retained earnings 163,400 125,200 Total shareholders'...
the Answer is Not 102700-179800= -77100
2016 ELKHARDT CORPORATION Statement of Financial Position December 31 2018 2017 Assets Current assets Cash $25,000 $19,900 Accounts receivable (net) 54,800 44,600 Inventory 100,000 85,200 Total current assets 179,800 149,700 Long-term investments 50,000 69,200 Property, plant, and equipment (net) 503,300 370,900 Total assets $733,100 $589,800 Liabilities and Shareholders' Equity Liabilities Current liabilities $84,100 $80,000 Non-current liabilities 154,200 84,400 Total liabilities 238,300 164,400 Shareholders' equity Common shares 331,400 300,200 Retained earnings 163,400 125,200 Total shareholders'...
 Data for Barry Computer Co. and its industry averages follow Barry Computer Company: Balance Sheet as of December 31, 2016 (In Thousands) Accounts payable Cash $174,960 $160,380 Receivables Other current liabilities 174,960 510,300 Inventories 393,660 Notes payable to bank 116,640 Total current assets $1,078,920 Total current liabilities $451,980 Long-term debt $335,340 Net fixed assets 379,080 Common equity 670,680 Total assets $1,458,000 Total liabilities and equity $1,458,000 Barry Computer Company: Income Statement for Year Ended December 31, 2016 (In Thousands) Sales...
Most questions answered within 3 hours.
-
Minitab Problem: Take the Lake Hume June rainfall data and find
use the processes outlined in...
asked 49 minutes ago -
X Company is trying to decide whether to continue using old
equipment to make Product A...
asked 50 minutes ago -
IN PYTHON ONLY !! Program 2: Re-work
program #5 (WeeklyHours) from the previous assignment such that...
asked 1 hour ago -
The average length of time between arrivals at a turnpike
toll-booth is 26 seconds. What is...
asked 3 hours ago -
(a) A piston at 6.1 atm contains a gas that occupies a volume of
3.5 L....
asked 4 hours ago -
Please answer true or false. Words
cannot be changed or added in to make it true...
asked 4 hours ago -
An empty test tube weighs 15.923 grams. Then,
MgCl2•6H2O is added into the test tube. After...
asked 4 hours ago -
Assume memory access is 10 units of time and disk access is
10000 units of time....
asked 4 hours ago -
1. Are all good samples random?
2. Magazines often report surveys giving statistics such as “63%...
asked 4 hours ago -
Under all the various types of market structures, firms
must eventually earn some economic profits for...
asked 4 hours ago -
Consider the following fitness regime for a single locus trait
with two co-dominant alleles: w11 =...
asked 4 hours ago -
A large cable company reports the following.
80% of its customers subscribe to its cable TV...
asked 5 hours ago