

Homework Answers
a).
Let’s assume the production function be “Y = F(K, L) = K^a*L^b”, if we increase both the factor with proportion “z” then the we have.
=> F(zK, zL) = (zK)^a*(zL)^b = z^a+b*(K)^a*(L)^b = z^a+b*Y, => F(zK, zL) = z^a+b*Y. as we increase both the factor with proportion “z” the output also increases by “z^a+b”, => the production is homogeneous of degree “a+b”. Now, if “a+b > 1”, => the production function exhibits IRS, if “a+b < 1”, => the production function exhibits DRS and , if “a+b = 1”, => the production function exhibits CRS.
Now, here if “a=0.4, b=0.5”, => a+b = 0.9 < 1, => the production function exhibits DRS.
If “a=0.3, b=0.7”, => a+b = 1, => the production function exhibits CRS.
Finally, if “a=0.6, b=0.6”, => a+b = 1.2 > 1, => the production function exhibits IRS.
b).
The production function is given by, => Y = K^a*L^b, where factors are paid their marginal products. So, the marginal product of both the inputs are given by.
=> MPL = dY/dL = b*L^b-1*K^a, and MPK = dY/dK = a*K^a-1*L^b.
So, the labor share of income is given by, => MPL*L/Y = [b*L^b-1*K^a]*L/Y = [b*L^b*K^a]/ L^b*K^a.
=> MPL*L/Y = b = labor share of income.
Similarly, the capital share of income is given by, => MPK*K/Y = [a*K^a-1*L^b]*K/Y.
=> MPK*K/Y = [a*K^a*L^b]/ L^b*K^a = a = capital share of income.
Here we have given that the “a=0.3” and “b=0.7”, => the labor share and the capital share of income are “0.7” and “0.3” respectively.
c).
The production function is given by, => Y = K^a*L^b, => LogY = a*LogK + b*LogL.
=> dLogY = a*dLogK + b*dLogL, => gY = a*gK + b*gL, here “labor” is fixed as before, => “gL=0” and capital destroy by 30%, => “gK = 30% = 0.3”, => the above relationship can written as f
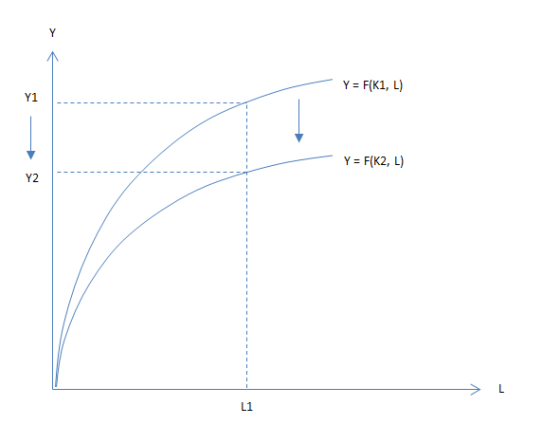
=> gY = a*gK + b*gL, => gY = a*(-0.3) + b*0 = 0.3*(-0.3) = (-0.09) = (-9%), => output also decreases by “9%”. The following fig shows the total output initially and new after the change in capital.
ii).
The real rental rate is given by, => R/P = MPK, => MPK = a*K^a-1*L^b, => R/P = a*K^a-1*L^b.
=> gr = (a-1)*gK + b*gL, => gr = (0.3-1)*(-0.3) = 0.21 > 0, => gr = 21%. So, as the capital decreases by 30% the real rental rate will increase by 21%. The following fig shows the increase in real rental rate.

iii).

The real wage rate is given by, => W/P = MPL, => MPL = b*K^a*L^b-1, => W/P = b*K^a*L^b-1.
=> gw = a*gK + (b-1)*gL, => gw = 0.3*(-0.3) + 0 = (-0.09) < 0, => gw = (-9)%. So, as the capital decreases by 30% the real wage rate will also decrease by 9%. The above fig shows the decrease in real wage rate.
Add Answer to:
There are 2 pages in this assignment. There are 3 questions with parts. The weight of...
(25pts) 2. Suppose the government wants to reduce its budget deficit. Using the long-run model of...
 (25pts) 2. Suppose the government wants to reduce its budget deficit. Using the long-run model of the economy developed in Chapter 3, illustrate graphically the impact of the alternative fiscal policy measures indicated in parts (a) and (b) below. Be sure to label: (i) the axes, (ii) the curves, (iii) the initial equilibrium values; (iv) the direction curves shift; and (v) the final equilibrium values. (15) a) Suppose the government decides to reduce the government's budget deficit by reducing government...
Suppose the government decides to reduce both government expenditures and taxes by the same amount (this...
Suppose the government decides to reduce both government expenditures and taxes by the same amount (this is a “balanced budget” change). What happens to: (i) national saving; (ii) the real interest rate; (iii) investment; (iv) consumption; and (v) output? Illustrate graphically using the The loanable funds market graph and explain in words why these variables change or why they do not change.
Suppose a government decides to reduce spending and (lump-sum) income taxes by the same amount. Using...
Suppose a government decides to reduce spending and (lump-sum) income taxes by the same amount. Using the long-run model of the economy, graphically illustrate the impact of the equal reductions in spending and taxes. Be sure to label: i. the axes; ii. the curves; iii. the initial equilibrium values; iv. The direction the curves shift; and v. the terminal equilibrium values. b. State in words what happens to: i. the real interest rate; ii. national saving; iii. investment; iv. consumption;...
4. Using the long-run model of the economy developed in Chapter 3, explain and/or show graphically...
4. Using the long-run model of the economy developed in Chapter 3, explain and/or show graphically the impact of increased investment demand has on the economy. Be sure to label: i. the axes; ii. the curves; iii. the initial equilibrium values; iv. the direction curves shift; and v. the terminal equilibrium values. Be sure to explain what happens to: i. the real interest rate; ii. national saving; iii. investment; iv. consumption; and v. output. 5. Using the long-run model of...
You are given the following information about an economy(interest rate is measured in percentage points). A...
 You
are given the following information about an economy(interest rate
is measured in percentage points). A five percent interest is r =
5.
1. You are given the following information about an economy (note: the interest rate is measured in percentage points. A five percent interest is r5): (M/P) = 100 (M/P)"=0.2 Y - 10 C = 150+ 0.667 YD-10 I=200 - 10r + 0.1 Y G=200 NX = 50 | T = 0.25 Y YD = Y-T A. (i)...
You
are given the following information about an economy(interest rate
is measured in percentage points). A five percent interest is r =
5.
1. You are given the following information about an economy (note: the interest rate is measured in percentage points. A five percent interest is r5): (M/P) = 100 (M/P)"=0.2 Y - 10 C = 150+ 0.667 YD-10 I=200 - 10r + 0.1 Y G=200 NX = 50 | T = 0.25 Y YD = Y-T A. (i)...
21. G increase with algebra. Consider an economy described by the following model. Y = K1/3L2/3...
 21. G increase with algebra. Consider an economy described by the following model. Y = K1/3L2/3 K = 1000; L = 1000 G = 100 T = 100 C = 250 + 0.5(Y-T) 1 = 600 – 100r Calculate the equilibrium real interest rate, national saving, public saving, private saving, consumption, output, and investment. (Hint: you probably don't want to solve for them it in that order.) i.rs ii. national saving = iii. public saving = iv. private saving =...
Consider the following production function for an economy: 1. Y=2K1/4L3/4 (a) Suppose the capital stock is...
 Consider the following production function for an economy: 1. Y=2K1/4L3/4 (a) Suppose the capital stock is K = 16 and its labour force is L = 1. Find: (i) GDP; (ii) the marginal product of capital; (iii) the real rental price of capital; (iv) labour's share of income. (b) Suppose further that aggregate consumption (C) is 80 per cent of disposable income, government spending is G = 1, the budget is balanced, and private sector investment is I = 6...
Question 2 In the Keynesian cross, assume that the consumption function is given by C =...
 Question 2 In the Keynesian cross, assume that the consumption function is given by C = 150 +0.7 (Y-T) Planned investment is: I = 100 – 10 *r Government purchases and taxes are both 50. a. Graph consumption as function of income. b. Graph investment as function of the real interest rate. c. Suppose that the real interest rate is 5. Write the equation of the planned expenditure. d. Suppose that the real interest rate is 5. What is the...
Q1140 points] Briefly, but not unsatisfactorily, answer the following questions. a) Using the Key...
 Q1140 points] Briefly, but not unsatisfactorily, answer the following questions. a) Using the Keynesian cross model where the goods market equilibrium is determined and analyzed, graphically derive the IS curve, and explain each step. Explain what the equilibrium in the goods market implies for the IS curve, i.e., why is the IS curve downward sloping. Also, explain what causes shifts in the IS curve. b) First, based on the analysis of the financial market equilibrium, graphically derive the LM curve....
1. Use the Keynesian cross model and show graphically in which direction will equilibrium level of...
1. Use the Keynesian cross model and show graphically in which direction will equilibrium level of income (or output) change. For each of the following, write down the formula for the size of the change of income (i.e. write down the formula for ∆Y): (i) An increase in government purchases (ii) An increase in taxes (iii) An increase in government purchase and an increase in taxes of equal amount (Nb: You must draw a SEPARATE graph for parts (i) and...
 (25pts) 2. Suppose the government wants to reduce its budget deficit. Using the long-run model of the economy developed in Chapter 3, illustrate graphically the impact of the alternative fiscal policy measures indicated in parts (a) and (b) below. Be sure to label: (i) the axes, (ii) the curves, (iii) the initial equilibrium values; (iv) the direction curves shift; and (v) the final equilibrium values. (15) a) Suppose the government decides to reduce the government's budget deficit by reducing government...
 You
are given the following information about an economy(interest rate
is measured in percentage points). A five percent interest is r =
5.
1. You are given the following information about an economy (note: the interest rate is measured in percentage points. A five percent interest is r5): (M/P) = 100 (M/P)"=0.2 Y - 10 C = 150+ 0.667 YD-10 I=200 - 10r + 0.1 Y G=200 NX = 50 | T = 0.25 Y YD = Y-T A. (i)...
You
are given the following information about an economy(interest rate
is measured in percentage points). A five percent interest is r =
5.
1. You are given the following information about an economy (note: the interest rate is measured in percentage points. A five percent interest is r5): (M/P) = 100 (M/P)"=0.2 Y - 10 C = 150+ 0.667 YD-10 I=200 - 10r + 0.1 Y G=200 NX = 50 | T = 0.25 Y YD = Y-T A. (i)...
 21. G increase with algebra. Consider an economy described by the following model. Y = K1/3L2/3 K = 1000; L = 1000 G = 100 T = 100 C = 250 + 0.5(Y-T) 1 = 600 – 100r Calculate the equilibrium real interest rate, national saving, public saving, private saving, consumption, output, and investment. (Hint: you probably don't want to solve for them it in that order.) i.rs ii. national saving = iii. public saving = iv. private saving =...
 Consider the following production function for an economy: 1. Y=2K1/4L3/4 (a) Suppose the capital stock is K = 16 and its labour force is L = 1. Find: (i) GDP; (ii) the marginal product of capital; (iii) the real rental price of capital; (iv) labour's share of income. (b) Suppose further that aggregate consumption (C) is 80 per cent of disposable income, government spending is G = 1, the budget is balanced, and private sector investment is I = 6...
 Question 2 In the Keynesian cross, assume that the consumption function is given by C = 150 +0.7 (Y-T) Planned investment is: I = 100 – 10 *r Government purchases and taxes are both 50. a. Graph consumption as function of income. b. Graph investment as function of the real interest rate. c. Suppose that the real interest rate is 5. Write the equation of the planned expenditure. d. Suppose that the real interest rate is 5. What is the...
 Q1140 points] Briefly, but not unsatisfactorily, answer the following questions. a) Using the Keynesian cross model where the goods market equilibrium is determined and analyzed, graphically derive the IS curve, and explain each step. Explain what the equilibrium in the goods market implies for the IS curve, i.e., why is the IS curve downward sloping. Also, explain what causes shifts in the IS curve. b) First, based on the analysis of the financial market equilibrium, graphically derive the LM curve....
Most questions answered within 3 hours.
-
Problem 1: Present entries to record the selected transactions
described below:
(a)
Issued $2,790,000 of 5-year,...
asked 1 minute ago -
Using technology to support HR activities increases:
a.
the efficiency of the administrative HR functions.
b....
asked 2 minutes ago -
1. List the features used to classify leaf
types.
2. List some characteristics that are shared...
asked 7 minutes ago -
The three elements of Value Proposition, Key Customers, and
Capabilities operate within an environment. Which of...
asked 9 minutes ago -
Katelynn, a physician, earns $200,000 from her medical practice
in the current year. She receives $45,000...
asked 17 minutes ago -
Each row of the table below describes an aqueous solution at
25°C
.
The second column...
asked 21 minutes ago -
A horizontal wire is at y = 0. Current travels in the +x
direction. The magnetic...
asked 22 minutes ago -
Let X be a continuous random variable whose PDF is Let X be a
continuous random...
asked 43 minutes ago -
Martinez Company’s relevant range of production is 7,500 units
to 12,500 units. When it produces and...
asked 41 minutes ago -
A football with a mass of 1.2 kg is kicked from ground level to
a height...
asked 46 minutes ago -
Remember: Changes in supply determinants shift supply, and
changes in demand determinants shift demand. We say...
asked 45 minutes ago -
Why is the answer b), for this question? I came up with C) for
my incorrect...
asked 51 minutes ago