1. Consider a low-wage labor market. Workers in this market are not presently covered by the...
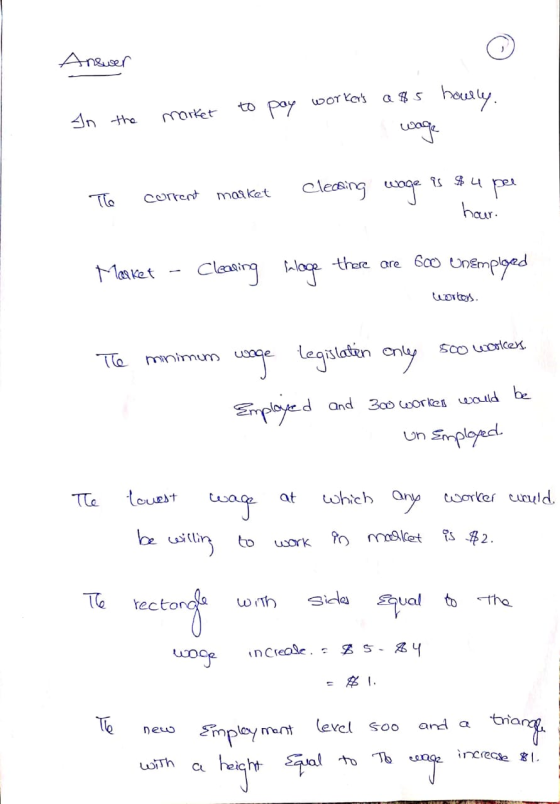
1. Consider a low-wage labor market. Workers in this market are not presently covered by the minimum wage. But the government is still considering implementing such legislation. If implemented, this law would require employers in the market to pay workers a $5 hourly wage. Suppose all workers in the market are equally productive, the current market clearing wage is $4 per hour., and that at this market- clearing wage there are 600 employed workers. Further suppose that under the minimum wage legislation, only 500 workers would be employed and 300 workers would be unemployed. Finally, assume that the market demand and supply curves are linear and that the market reservation wage, the lowest wage at which any worker would be willing to work in the market, is $2. Compute dollar value of the impact of the policy on employers, workers and society as a whole
Homework Answers


Add Answer to:
1. Consider a low-wage labor market. Workers in this market are
not presently covered by the...
4. Suppose that in a competitive labor market, demand for workers is Qp- 10,000 - 100W...
 4. Suppose that in a competitive labor market, demand for workers is Qp- 10,000 - 100W and the labor supply is Qs 2000+190oW, where Q is the quantity of workers employed and W is the hourly wage. [io pts. each] a. What is the initial equilibrium wage and employment level? b. Suppose that the government imposes a minimum wage of s5 per hour. How many people will be employed under the new minimum wage law? Suppose that the demand for...
In a competitive labor market, demand for workers is QD 20,000 100W, and supply is Qs...
 In a competitive labor market, demand for workers is QD 20,000 100W, and supply is Qs 4,000 + 1,900W, where Q is the quantity of workers employed and W is the hourly wage. a) What is the initial equilibrium wage and employment level? b) Suppose that the government decides that $9 per hour is the minimum allowable wage in any market. What would the new employment level be? c) What would happen to total payments to labor? d) Would there...
5. Minimum-wage laws and unemployment Consider the market for labor depicted by the demand and supply...
5. Minimum-wage laws and unemployment Consider the market for labor depicted by the demand and supply curves that follow. Use the calculator to help you answer the following questions. You will not be graded on any changes you make to the calculator. 0 125 250 375 500 625 750 875 1000 20.0 17.5 15.0 12.5 10.0 7.5 5.0 2.5 0 WAGE (Dollars per hour) LABOR (Thousands of workers) Demand Supply Graph Input Tool Market for Labor Wage (Dollars per hour)...
4. Minimum wage legislation The following graph shows the labor market in the fast-food industry in...
 4. Minimum wage legislation The following graph shows the labor market in the fast-food industry in the fictional town of Supersize City. Use the graph input tool to help you answer the following questions. You will not be graded on any changes you make to this graph. Note: Once you enter a value in a white field, the graph and any corresponding amounts in each grey field will change accordingly. In this market, the equilibrium hourly wage is and the equilibrium quantity of laboris...
4. Minimum wage legislation The following graph shows the labor market in the fast-food industry in...
 4. Minimum wage legislation The following graph shows the labor market in the fast-food industry in the fictional town of Supersize City. tool to help you answer the following questions. You will not be graded on any changes you make to this graph. Note: Once you enter a value in a white field, the graph and any corresponding amounts in each grey field will change accordingly. Graph Input Tool Market for Labor in the Fast Food Industry 20 18 16...
Question 1 Consider a labor market in which the aggregate labor demand and aggregate labor supply...
Question 1 Consider a labor market in which the aggregate labor demand and aggregate labor supply are given by: LD=50−3w LS=3w+3 Where quantities are measured in thousands. At the current minimum wage, there are 36,000 workers willing to supply their labor. How many workers are currently unemployed? -25 -25,000 -19 -19,000 -Cannot be calculated since the minimum wage is not given
consider a labor market experiment involving four buyers (firms) and four sellers (workers). Each firm seeks...
consider a labor market experiment involving four buyers (firms) and four sellers (workers). Each firm seeks to hire a single worker and each worker can work for a single firm. Each firm has a maximum revenue they can earn per worker hired. Each worker has a cost of working, which represents the value of his or her leisure time. Suppose the revenues from hiring a worker are $23, $15 and $21 and $17 for firms 1, 2, 3 and 4,...
4. Minimum wage legislation The following graph shows the labor market in the fast-food industry in...
 4. Minimum wage legislation The following graph shows the labor market in the fast-food industry in the fictional town of Supersize City. Use the graph input tool to help you answer the following questions. You will not be graded on any changes you make to this graph. Note: Once you enter a value in a white field, the graph and any corresponding amounts in each grey field will change accordingly. In this market, the equilibrium hourly wage is _______ , and the equilibrium...
6. Low-skilled workers operate in a competitive market. The labor supply is Q 10W (where W...
 6. Low-skilled workers operate in a competitive market. The labor supply is Q 10W (where W is the price of labor measured by the hourly wage) and the demand for labor is Q 240 20W. Q measures the quantity of labor hired (in thousands of hours). a. What is the equilibrium wage and quantity of low-skilled labor working in equilibrium? b Ifthe government passes a minimum wage of $9 per hour, what will be the new quantity oflabor hired will...
4. Minimum wage legislation The following graph shows the labor market in the fast-food industry in...
 4. Minimum wage legislation The following graph shows the labor market in the fast-food industry in the fictional town of Supersize City. Use the graph input tool to help you answer the following questions. You will not be graded on any changes you make to this graph. Note: Once you enter a value in a white field, the graph and any corresponding amounts in each grey field will change accordingly. Graph Input Tool Market for Labor in the Fast Food...
 4. Suppose that in a competitive labor market, demand for workers is Qp- 10,000 - 100W and the labor supply is Qs 2000+190oW, where Q is the quantity of workers employed and W is the hourly wage. [io pts. each] a. What is the initial equilibrium wage and employment level? b. Suppose that the government imposes a minimum wage of s5 per hour. How many people will be employed under the new minimum wage law? Suppose that the demand for...
 In a competitive labor market, demand for workers is QD 20,000 100W, and supply is Qs 4,000 + 1,900W, where Q is the quantity of workers employed and W is the hourly wage. a) What is the initial equilibrium wage and employment level? b) Suppose that the government decides that $9 per hour is the minimum allowable wage in any market. What would the new employment level be? c) What would happen to total payments to labor? d) Would there...
 4. Minimum wage legislation The following graph shows the labor market in the fast-food industry in the fictional town of Supersize City. tool to help you answer the following questions. You will not be graded on any changes you make to this graph. Note: Once you enter a value in a white field, the graph and any corresponding amounts in each grey field will change accordingly. Graph Input Tool Market for Labor in the Fast Food Industry 20 18 16...
 6. Low-skilled workers operate in a competitive market. The labor supply is Q 10W (where W is the price of labor measured by the hourly wage) and the demand for labor is Q 240 20W. Q measures the quantity of labor hired (in thousands of hours). a. What is the equilibrium wage and quantity of low-skilled labor working in equilibrium? b Ifthe government passes a minimum wage of $9 per hour, what will be the new quantity oflabor hired will...
 4. Minimum wage legislation The following graph shows the labor market in the fast-food industry in the fictional town of Supersize City. Use the graph input tool to help you answer the following questions. You will not be graded on any changes you make to this graph. Note: Once you enter a value in a white field, the graph and any corresponding amounts in each grey field will change accordingly. Graph Input Tool Market for Labor in the Fast Food...
Most questions answered within 3 hours.
-
Using MARS simulator, write MIPS programs according to
the following scenarios: Receive a positive integer number...
asked 12 minutes ago -
An object in front of a concave mirror has a real image that is
11.5 cm...
asked 26 minutes ago -
Consider the reaction, C3 H8 + O2 --> CO2 + H2O. How many
moles of O2...
asked 2 hours ago -
You and your opponent both roll a fair die. If you both roll the
same number,...
asked 2 hours ago -
In a study of the accuracy of fast food drive-through orders,
Restaurant A had 257 accurate...
asked 2 hours ago -
Identify and describe in detail the four categories of
institutions that could be included in a...
asked 2 hours ago -
In python
class Customer:
def __init__(self, customer_id, last_name, first_name, phone_number, address):
self._customer_id = int(customer_id)
self._last_name =...
asked 2 hours ago -
What is an example of a limitation in implementing a new
ERP system and how it...
asked 2 hours ago -
In a section of 9.7cm of an artery with a radius of 2.6mm there
is a...
asked 2 hours ago -
the two carboxylic acid groups of aspartic acid have different
acidities with pKa values of 2.1...
asked 2 hours ago -
Would CuCO3 aqueous salt combined with calcium chloride
form a solid precipitate? If so, what would...
asked 2 hours ago -
How do ECM Solutions assist in embedding a culture of continuous
improvement in an organization? (Project...
asked 3 hours ago