


Homework Answers

Add Answer to:
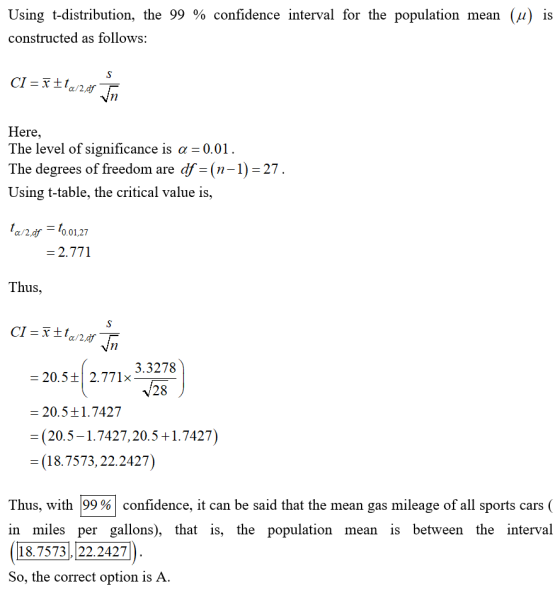
The gas mileages (in miles per gallon) of 28 randomly selected sports cars are listed in...
The gas mileages (in miles per gallon) of 25 randomly selected sports cars are listed in...
The gas mileages (in miles per gallon) of 25 randomly selected sports cars are listed in the accompanying table. Assume the mileages are not normally distributed. Use the standard normal distribution or the t-distribution to construct a 95% confidence interval for the population mean. Justify your decision. If neither distribution can be used, explain why. Interpret the results. 20 31 17 20 19 24 17 23 25 21 21 30 17 22 23 24 21 24 21 18 19 19...
The gas mileages (in miles per gallon)
The gas mileages (in miles per gallon) for 22 cars are shown in the frequency distribution. Approximate the mean of the frequency distribution.
The gas mileages (in miles per gallon) for 30 cars are shown in the frequency distribution....
 The gas mileages (in miles per gallon) for 30 cars are shown in the frequency distribution. Approximate the mean of the frequency distribution.The approximate mean of the frequency distribution is _______ (Round to one decimal place as needed.)
In a random sample of ten people, the mean driving distance to work was 18.6 miles...
 In a random sample of ten people, the mean driving distance to work was 18.6 miles and the standard deviation was 6.5 miles. Assume the population is normally distributed and use the t-distribution to find the margin of error and construct a 90% confidence interval for the population mean . Interpret the results. Identify the margin of error. (Round to one decimal place as needed.) Construct a 90% confidence interval for the population mean (Round to one decimal place as...
The average gas mileage of a certain model car is 29 miles per gallon. If the...
The average gas mileage of a certain model car is 29 miles per gallon. If the gas mileages are normally distributed with a standard deviation of 2.4, find the probability that a car has a gas mileage of between 30 and 35 miles per gallon.
idenitfy the margin of error( round to one decimal place) is it square miles? miles? miles...
 idenitfy the margin of error( round to one decimal place) is
it square miles? miles? miles ler hour?
construct a 90% confidence interval for the population
mean?
interpret
of 14 10 complete HW Score: 41.84, 5.86 of 14 Score: 0 of 1 pt X 6.2.18-T Question in a random sample of twee people, the mean driving dance to work was 24.1. 90% confidence interval for the population mean Interpret the results and the sandard deviation was 75 miles. Assume the...
idenitfy the margin of error( round to one decimal place) is
it square miles? miles? miles ler hour?
construct a 90% confidence interval for the population
mean?
interpret
of 14 10 complete HW Score: 41.84, 5.86 of 14 Score: 0 of 1 pt X 6.2.18-T Question in a random sample of twee people, the mean driving dance to work was 24.1. 90% confidence interval for the population mean Interpret the results and the sandard deviation was 75 miles. Assume the...
Use the standard normal distribution or the t-distribution to construct a 99% confidence interval for the...
 Use the standard normal distribution or the t-distribution to construct a 99% confidence interval for the population mean. Justify your decision. If neither distribution can be used, explain why. Interpret the results. In a recent season, the population standard deviation of the yards per carry for all running backs was 1.27. The yards per carry of 25 randomly selected running backs are shown below. Assume the yards per carry are normally distributed. 2.9 8.4 7.2 4.3 6.8 2.7 7.2 4.8...
Use the standard normal distribution or the t-distribution to construct a 99% confidence interval for the...
 Use the standard normal distribution or the t-distribution to construct a 99% confidence interval for the population mean. Justify your decision. If neither distribution can be used, explain why. Interpret the results. In a recent season, the population standard deviation of the yards per carry for all running backs was 1.21. The yards per carry of 25 randomly selected running backs are shown below. Assume the yards per carry are normally distributed. 3.2 6.8 6.1 3.6 6.3 7.1 6.4 5.5...
Use the standard normal distribution or the t distribution to construct a 9 % confidence interval...
 Use the standard normal distribution or the t distribution to construct a 9 % confidence interval for the population mean Justify your decision if neither distribution can be used, explain why Interpret the results ln a random sample of 17 mortgage institutions, the mean interest rate was 3.69% and the standard deviation was 36% Assume the iterest rates are normally distributed Which distribution should be used to construct the confidence interval? ○ A. Use a t-distribution because it is a...
Gas mileage (measured in miles per gallon) of a new car model is normally distributed with...
Gas mileage (measured in miles per gallon) of a new car model is normally distributed with a mean of 95 miles per gallon and a standard deviation of 17 miles per gallon. What is the median of this distribution? A.95 B.75 C.105 D.85 E.65
 In a random sample of ten people, the mean driving distance to work was 18.6 miles and the standard deviation was 6.5 miles. Assume the population is normally distributed and use the t-distribution to find the margin of error and construct a 90% confidence interval for the population mean . Interpret the results. Identify the margin of error. (Round to one decimal place as needed.) Construct a 90% confidence interval for the population mean (Round to one decimal place as...
 idenitfy the margin of error( round to one decimal place) is
it square miles? miles? miles ler hour?
construct a 90% confidence interval for the population
mean?
interpret
of 14 10 complete HW Score: 41.84, 5.86 of 14 Score: 0 of 1 pt X 6.2.18-T Question in a random sample of twee people, the mean driving dance to work was 24.1. 90% confidence interval for the population mean Interpret the results and the sandard deviation was 75 miles. Assume the...
idenitfy the margin of error( round to one decimal place) is
it square miles? miles? miles ler hour?
construct a 90% confidence interval for the population
mean?
interpret
of 14 10 complete HW Score: 41.84, 5.86 of 14 Score: 0 of 1 pt X 6.2.18-T Question in a random sample of twee people, the mean driving dance to work was 24.1. 90% confidence interval for the population mean Interpret the results and the sandard deviation was 75 miles. Assume the...
 Use the standard normal distribution or the t-distribution to construct a 99% confidence interval for the population mean. Justify your decision. If neither distribution can be used, explain why. Interpret the results. In a recent season, the population standard deviation of the yards per carry for all running backs was 1.27. The yards per carry of 25 randomly selected running backs are shown below. Assume the yards per carry are normally distributed. 2.9 8.4 7.2 4.3 6.8 2.7 7.2 4.8...
 Use the standard normal distribution or the t-distribution to construct a 99% confidence interval for the population mean. Justify your decision. If neither distribution can be used, explain why. Interpret the results. In a recent season, the population standard deviation of the yards per carry for all running backs was 1.21. The yards per carry of 25 randomly selected running backs are shown below. Assume the yards per carry are normally distributed. 3.2 6.8 6.1 3.6 6.3 7.1 6.4 5.5...
 Use the standard normal distribution or the t distribution to construct a 9 % confidence interval for the population mean Justify your decision if neither distribution can be used, explain why Interpret the results ln a random sample of 17 mortgage institutions, the mean interest rate was 3.69% and the standard deviation was 36% Assume the iterest rates are normally distributed Which distribution should be used to construct the confidence interval? ○ A. Use a t-distribution because it is a...
Most questions answered within 3 hours.
-
Buses are powered by chemical reactions. Define matter and the
four states of matter. What is...
asked 14 minutes ago -
Use conservation of energy to find the velocity of a free point
charge q1 at 22cm...
asked 21 minutes ago -
First, describe policies promoted by governments of the
political right to address economic globalization. Second, describe...
asked 38 minutes ago -
M2-9 Completing T-Accounts LO2-4
Following are the transactions of Dennen, Inc., for the month of
January....
asked 39 minutes ago -
Write a program using python that reads from values from a text
file and plots them...
asked 40 minutes ago -
Look up the density of
the metal of the object used in parts A and B...
asked 39 minutes ago -
Discuss strategic considerations that Amazon and NYC politicians
had. Analyze why the deal between Amazon and...
asked 42 minutes ago -
A combustion reaction is describes as a carbon source reacting
with oxygen and producing carbon dioxide...
asked 57 minutes ago -
Buckminsterfullerence is a recently allotrope of carbon in which
carbon atoms form molecules of formula C_60,...
asked 1 hour ago -
Lower Equitorial and Upper Equitorial are the same except Lower
Equitorial has a larger capital stock....
asked 1 hour ago -
how do you think that pH of a jar where you have added a certain
amount...
asked 1 hour ago -
If the Federal Reserve increases the reserve requirement, what
will happen to the Money Supply in...
asked 1 hour ago