
Homework Answers
matlab part: a
clc;
clear all;
close all;
s=tf('s');
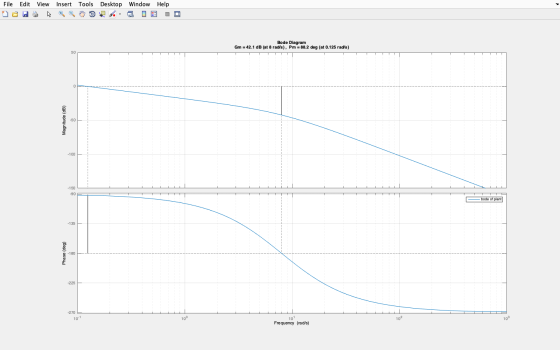
g=8/(s*(s+8)^2);% plant
margin(g);grid
legend('bode of plant')
figure
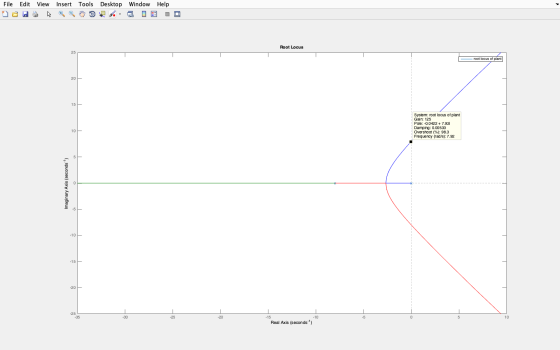
rlocus(g);
legend('root locus of plant')
matlab part b)
clc;
clear all;
close all;
s=tf('s');
k=40;
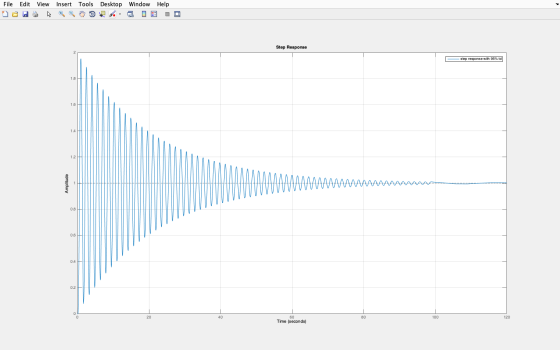
t95=0.1528;% 95% of delay time
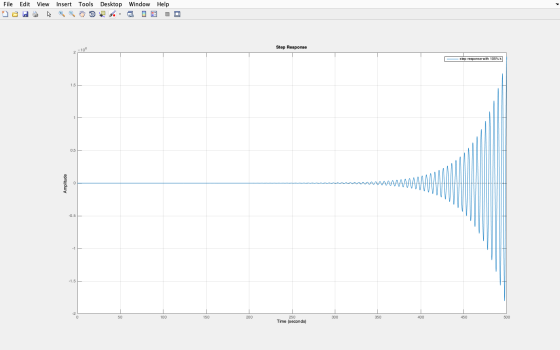
t105=0.1688;% 105% of delaytime
gc1=exp(-t95*s);
gc2=exp(-t105*s);
g=8/(s*(s+8)^2);% plant
step(feedback(k*g*gc1,1));grid
legend('step response with 95% td')
figure
step(feedback(k*g*gc2,1));grid
legend('step response with 105% td')
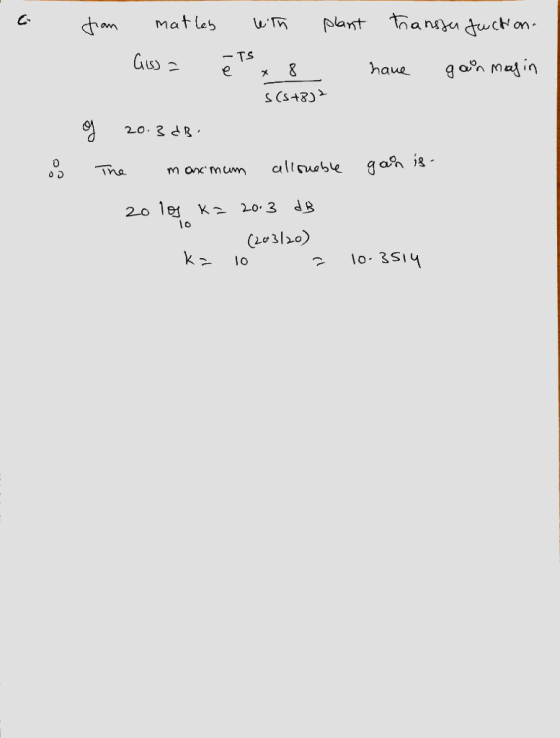
 matlab part c)
clc;
clear all;
close all;
s=tf('s');
k95=9.8338;
k105=10.869;
gc=exp(-s);
g=8/(s*(s+8)^2);% plant
step(feedback(k95*g*gc,1));grid
legend('step response with 95% k')
figure
step(feedback(k105*g*gc,1));grid
legend('step response with 105% k')

Add Answer to:
Consider the following closed-loop system, in which the plant model is P(s) = elave R()2-CO POTY()...
1. Consider the usual unity-feedback closed-loop control system with a proportional-gain controll...
 1. Consider the usual unity-feedback closed-loop control system with a proportional-gain controller Sketch (by hand) and fully label a Nyquist plot with K-1 for each of the plants listed below.Show all your work. Use the Nyquist plot to determine all values of K for which the closed-loop system is stable. Check your answers using the Routh-Hurwitz Stability Test. [15 marks] (a) P(s)-2 (b) P(s)-1s3 (c) P(s) -4-8 s+2 (s-2) (s+10)
1. Consider the usual unity-feedback closed-loop control system with a...
1. Consider the usual unity-feedback closed-loop control system with a proportional-gain controller Sketch (by hand) and fully label a Nyquist plot with K-1 for each of the plants listed below.Show all your work. Use the Nyquist plot to determine all values of K for which the closed-loop system is stable. Check your answers using the Routh-Hurwitz Stability Test. [15 marks] (a) P(s)-2 (b) P(s)-1s3 (c) P(s) -4-8 s+2 (s-2) (s+10)
1. Consider the usual unity-feedback closed-loop control system with a...
Use rlocus in MATLAB to plot the root locus for a closed loop control system with the plant trans...
 Use rlocus in MATLAB to plot the root locus for a closed loop control system with the plant transfer function 8. z 2 2)2-0.1z +0.06 For what value of k is the closed loop system stable? 9. The characteristic equation for a control system is given as z2(0.2 +k)z 6k +2-0 Use Routh-Hurwitz criterion to find when the system is stable. 10. Use MATLAB to plot the root locus for the system given in Problem 9. Compare your conclusion in...
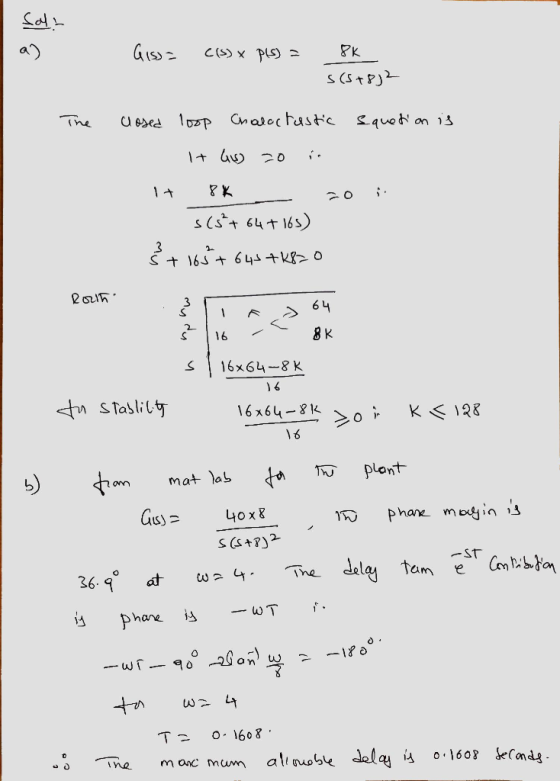
Consider the system shown as below. Draw a Bode diagram of the open-loop transfer function G(s).
 1 Consider the system shown as below. Draw a Bode diagram of the open-loop transfer function G(s). Determine the phase margin, gain-crossover frequency, gain margin and phase-crossover frequency, (Sketch the bode diagram by hand) 2 Consider the system shown as below. Use MATLAB to draw a bode diagram of the open-loop transfer function G(s). Show the gain-crossover frequency and phase-crossover frequency in the Bode diagram and determine the phase margin and gain margin. 3. Consider the system shown as below. Design a...
This problem explores the effect of closed-loop zeros on the system response. Suppose ?(?) = ??...
 This problem explores the
effect of closed-loop zeros on the system response. Suppose ?(?) =
?? (?)?? (?) where ?? (?) = ? a proportional controller. The plant
??(?) takes on two different systems in Problem 1 and in Problem
2
1. Suppose ??1 (?) = 1 ?(? 2+6?+45) a. Find the open-loop poles
and the closed-loop poles when ? = 40 b. Find and plot the
closed-loop unit step response, that is, find ?(?), ? > 0 when
?(?)...
This problem explores the
effect of closed-loop zeros on the system response. Suppose ?(?) =
?? (?)?? (?) where ?? (?) = ? a proportional controller. The plant
??(?) takes on two different systems in Problem 1 and in Problem
2
1. Suppose ??1 (?) = 1 ?(? 2+6?+45) a. Find the open-loop poles
and the closed-loop poles when ? = 40 b. Find and plot the
closed-loop unit step response, that is, find ?(?), ? > 0 when
?(?)...
1. [25%] Consider the closed-loop system shown where it is desired to stabilize the system with...
 1. [25%] Consider the closed-loop system shown where it is desired to stabilize the system with feedback where the control law is a form of a PID controller. Design using the Root Locus Method such that the: a. percent overshoot is less than 10% for a unit step b. settling time is less than 4 seconds, c. steady-state absolute error (not percent error) due to a unit ramp input (r=t) is less than 1. d. Note: The actuator u(t) saturates...
Please solve it with step by step MATLAB code, thank you! Suppose that a system is shown in Figure 2. Based on for loop, write a piece of MATLAB code to calculate the closed loop poles for 03K35 and...
 Please solve it with step by step MATLAB code, thank you!
Suppose that a system is shown in Figure 2. Based on for loop, write a piece of MATLAB code to calculate the closed loop poles for 03K35 and plot the outputs where the poles are represented by "W" letter. Find the interval of K parameter for stability using Routh-Hurwitz method. Calculate the poles of the closed loop transfer function where K attains the minimum value such that the system...
Please solve it with step by step MATLAB code, thank you!
Suppose that a system is shown in Figure 2. Based on for loop, write a piece of MATLAB code to calculate the closed loop poles for 03K35 and plot the outputs where the poles are represented by "W" letter. Find the interval of K parameter for stability using Routh-Hurwitz method. Calculate the poles of the closed loop transfer function where K attains the minimum value such that the system...
1. Consider the usual unity-feedback closed-loop control system with a proportional-gain controller: 19 r - PGS-Try...
 1. Consider the usual unity-feedback closed-loop control system with a proportional-gain controller: 19 r - PGS-Try P(s) Draw (by hand) and fully label a Nyquist plot with K = 1 for each of the plants listed below. Show all your work. Use the Nyquist plot to determine all values of K for which the closed-loop system is stable. Check your answers using the Routh-Hurwitz Stability Test. [15 marks] (a) P(s) = (b) P(s) = s(s+13 (6+2) (©) P(s) = 32(6+1)
Consider the unity-feedback system shown below: R(s) E(s) input: r(t), output: y(t) C(s) P(s) error: e()...
 Consider the unity-feedback system shown below: R(s) E(s) input: r(t), output: y(t) C(s) P(s) error: e() r(t) y(t) closed-loop transfer-function: Hyr(sD t the closed-loop transfer-function be Hyr(s) Y (s) R(s) Let the transfer-function of the plant be P(s) 10 s (s 1) (s 5) The open-loop transfer-function is G(s) P(s) C(s) DESIGN OBJECTIVES: Find a controller C(s) such that the following are satisfied i) The closed-loop system is stable. ii) The steady-state error ess due to a unit-ramp input r(t)...
Question 2 System Stability in the s-Domain and in the Frequency Domain: Bode Plots, Root Locus...
 Question 2 System Stability in the s-Domain and in the Frequency Domain: Bode Plots, Root Locus Plots and Routh- Hurwitz Criterion ofStability A unit feedback control system is to be stabilized using a Proportional Controller, as shown in Figure Q2.1. Proportional Controller Process The process transfer function is described as follows: Y(s) G(s) s2 +4s 100 s3 +4s2 5s 2 Figure Q2.1 Your task is to investigate the stability of the closed loop system using s-domain analysis by finding: a)...
Let G,()+3s+5) , K-1 and Ge 1 I Determine the loop transfer function L(s)-KG.G. Use 'margin' command in matlab to generate the Bode Plot for L(s). (a) What are its gain and phase margins (the...
 Let G,()+3s+5) , K-1 and Ge 1 I Determine the loop transfer function L(s)-KG.G. Use 'margin' command in matlab to generate the Bode Plot for L(s). (a) What are its gain and phase margins (these should be available in the plots). (b) Convert the gain margin in dB to absolute value. (c) For what value of the gain K would the closed loop system become marginally stable? (d) Show that, for this value of K, the closed loop system does...
 1. Consider the usual unity-feedback closed-loop control system with a proportional-gain controller Sketch (by hand) and fully label a Nyquist plot with K-1 for each of the plants listed below.Show all your work. Use the Nyquist plot to determine all values of K for which the closed-loop system is stable. Check your answers using the Routh-Hurwitz Stability Test. [15 marks] (a) P(s)-2 (b) P(s)-1s3 (c) P(s) -4-8 s+2 (s-2) (s+10)
1. Consider the usual unity-feedback closed-loop control system with a...
1. Consider the usual unity-feedback closed-loop control system with a proportional-gain controller Sketch (by hand) and fully label a Nyquist plot with K-1 for each of the plants listed below.Show all your work. Use the Nyquist plot to determine all values of K for which the closed-loop system is stable. Check your answers using the Routh-Hurwitz Stability Test. [15 marks] (a) P(s)-2 (b) P(s)-1s3 (c) P(s) -4-8 s+2 (s-2) (s+10)
1. Consider the usual unity-feedback closed-loop control system with a...
 Use rlocus in MATLAB to plot the root locus for a closed loop control system with the plant transfer function 8. z 2 2)2-0.1z +0.06 For what value of k is the closed loop system stable? 9. The characteristic equation for a control system is given as z2(0.2 +k)z 6k +2-0 Use Routh-Hurwitz criterion to find when the system is stable. 10. Use MATLAB to plot the root locus for the system given in Problem 9. Compare your conclusion in...
 This problem explores the
effect of closed-loop zeros on the system response. Suppose ?(?) =
?? (?)?? (?) where ?? (?) = ? a proportional controller. The plant
??(?) takes on two different systems in Problem 1 and in Problem
2
1. Suppose ??1 (?) = 1 ?(? 2+6?+45) a. Find the open-loop poles
and the closed-loop poles when ? = 40 b. Find and plot the
closed-loop unit step response, that is, find ?(?), ? > 0 when
?(?)...
This problem explores the
effect of closed-loop zeros on the system response. Suppose ?(?) =
?? (?)?? (?) where ?? (?) = ? a proportional controller. The plant
??(?) takes on two different systems in Problem 1 and in Problem
2
1. Suppose ??1 (?) = 1 ?(? 2+6?+45) a. Find the open-loop poles
and the closed-loop poles when ? = 40 b. Find and plot the
closed-loop unit step response, that is, find ?(?), ? > 0 when
?(?)...
 1. [25%] Consider the closed-loop system shown where it is desired to stabilize the system with feedback where the control law is a form of a PID controller. Design using the Root Locus Method such that the: a. percent overshoot is less than 10% for a unit step b. settling time is less than 4 seconds, c. steady-state absolute error (not percent error) due to a unit ramp input (r=t) is less than 1. d. Note: The actuator u(t) saturates...
 Please solve it with step by step MATLAB code, thank you!
Suppose that a system is shown in Figure 2. Based on for loop, write a piece of MATLAB code to calculate the closed loop poles for 03K35 and plot the outputs where the poles are represented by "W" letter. Find the interval of K parameter for stability using Routh-Hurwitz method. Calculate the poles of the closed loop transfer function where K attains the minimum value such that the system...
Please solve it with step by step MATLAB code, thank you!
Suppose that a system is shown in Figure 2. Based on for loop, write a piece of MATLAB code to calculate the closed loop poles for 03K35 and plot the outputs where the poles are represented by "W" letter. Find the interval of K parameter for stability using Routh-Hurwitz method. Calculate the poles of the closed loop transfer function where K attains the minimum value such that the system...
 1. Consider the usual unity-feedback closed-loop control system with a proportional-gain controller: 19 r - PGS-Try P(s) Draw (by hand) and fully label a Nyquist plot with K = 1 for each of the plants listed below. Show all your work. Use the Nyquist plot to determine all values of K for which the closed-loop system is stable. Check your answers using the Routh-Hurwitz Stability Test. [15 marks] (a) P(s) = (b) P(s) = s(s+13 (6+2) (©) P(s) = 32(6+1)
 Consider the unity-feedback system shown below: R(s) E(s) input: r(t), output: y(t) C(s) P(s) error: e() r(t) y(t) closed-loop transfer-function: Hyr(sD t the closed-loop transfer-function be Hyr(s) Y (s) R(s) Let the transfer-function of the plant be P(s) 10 s (s 1) (s 5) The open-loop transfer-function is G(s) P(s) C(s) DESIGN OBJECTIVES: Find a controller C(s) such that the following are satisfied i) The closed-loop system is stable. ii) The steady-state error ess due to a unit-ramp input r(t)...
 Question 2 System Stability in the s-Domain and in the Frequency Domain: Bode Plots, Root Locus Plots and Routh- Hurwitz Criterion ofStability A unit feedback control system is to be stabilized using a Proportional Controller, as shown in Figure Q2.1. Proportional Controller Process The process transfer function is described as follows: Y(s) G(s) s2 +4s 100 s3 +4s2 5s 2 Figure Q2.1 Your task is to investigate the stability of the closed loop system using s-domain analysis by finding: a)...
 Let G,()+3s+5) , K-1 and Ge 1 I Determine the loop transfer function L(s)-KG.G. Use 'margin' command in matlab to generate the Bode Plot for L(s). (a) What are its gain and phase margins (these should be available in the plots). (b) Convert the gain margin in dB to absolute value. (c) For what value of the gain K would the closed loop system become marginally stable? (d) Show that, for this value of K, the closed loop system does...
Most questions answered within 3 hours.
-
A 8.15- g bullet from a 9-mm pistol has a velocity of 366.0 m/s.
It strikes...
asked 1 hour ago -
The outstanding bonds of Alpha Extracts have a yield to maturity
of 7.4 percent and a...
asked 1 hour ago -
The Problem: The Case of the Harmonizing Vacations
Your CEO is exploring partnering with a European...
asked 2 hours ago -
A chemical equation is balanced by adding coefficients in front
of some formulas so that the...
asked 2 hours ago -
From the literature (reference your sources): What are the
lattice parameters of calcite and aragonite? Why...
asked 3 hours ago -
Your system is rejecting the question am asking which is
preceded by a case study. It...
asked 3 hours ago -
3. On January 2, 2000, Larry creates a trust with himself as
trustee. Larry as trustee...
asked 3 hours ago -
A member of the volleyball team spikes the ball. During this
process, she changes the velocity...
asked 3 hours ago -
Are adult gamers less likely to use a gaming console (Xbox,
PlayStation, Wii, etc...) than teen...
asked 4 hours ago -
The University of
Texas recently reported that 43% of college students aged 18-24
would spend their...
asked 4 hours ago -
The length of stay at a specific emergency department in
Phoenix, Arizona, in 2009 had a...
asked 3 hours ago -
. Please give the mechanism for this type of problem. Step by
Step
The toxin that...
asked 3 hours ago