


Homework Answers
Add Answer to:
Question 41 Identify the range of diminishing marginal returns on the graph. Marginal Product Marginal and...
Question 2 [6 points] Afirm's average cost curves are shown below 120 AFC 105 ATC 90...
 Question 2 [6 points] Afirm's average cost curves are shown below 120 AFC 105 ATC 90 75- 60 45 30 15 0 6 Labour (workers per day) a) The marginal cost curve first declines and then increases because of Constant marginal revenue The decline in the gap between ATC and AVC as output expands Increasing. then diminishing, marginal utility Increasing, then diminishing. marginal retuns b) The vertical distance between ATC and AVC measures Average fixed oost Economic profit per unit...
D Question 7 1 pts Use the following graph that shows the marginal cost (MC) curve,...
 D Question 7 1 pts Use the following graph that shows the marginal cost (MC) curve, the Average Variable Cost (AVC) curve, and the Average Total Cost (ATC) curve. What is the variable cost when the quantity (Q) being produced is 6? P MC ATC /AVC $15 $11 $8 Q O $66 $8 O $15 $11 Question 8 1 pts Use the following graph that shows the marginal cost (MC) curve, the Average Variable Cost (AVC) curve, and the Average...
pogu u (a) Calculate the fixed cost (FC), average fixed cost (AFC), average variable cost (AVC),...
 pogu u (a) Calculate the fixed cost (FC), average fixed cost (AFC), average variable cost (AVC), average total cost (ATC) and marginal cost (MC) from the table below. Units of output Total cost AFC ATC FC 50 AVC 0 0 MC 0 0 80 128 180 280 405 (b) Draw graphs to plot these cost curves against output. (c) Explain what these shapes tell us about returns and efficiency.
Finish the table. MPL: Marginal production of labor TC: Total cost MC: Marginal Cost AFC: Average...
 Finish the table.
MPL: Marginal production of labor
TC: Total cost
MC: Marginal Cost
AFC: Average fixed cost
AVC: Average variable cost
ATC: Average total cost
lormal text - Times New... - 12 B I VA G E A E 1 E- Labor Week 6 Assignment: Production Costs 20 Points) Output MPL FC VC TC MC AFC AVC ATC (Q) 0 25 WN 25 50 75 100 13 25 15 F 16 25 125 1. Complete the table above. (4...
Finish the table.
MPL: Marginal production of labor
TC: Total cost
MC: Marginal Cost
AFC: Average fixed cost
AVC: Average variable cost
ATC: Average total cost
lormal text - Times New... - 12 B I VA G E A E 1 E- Labor Week 6 Assignment: Production Costs 20 Points) Output MPL FC VC TC MC AFC AVC ATC (Q) 0 25 WN 25 50 75 100 13 25 15 F 16 25 125 1. Complete the table above. (4...
MC TVC AFC AVC ATC TC Output TFC $500 $200 1 2 $800 $75 $875 $925...
 MC TVC AFC AVC ATC TC Output TFC $500 $200 1 2 $800 $75 $875 $925 $75 100 Refer to an above table. What is the average variable cost of producing three units of the output? $291.67 o $125 $100 $166.67 问题3 29 问题3 AVC ATC MC AFC Output TVC TC TFC $500 $200 $800 2 $75 $875 4 $925 5 100 $75 Which of the following is correct for this firm with the cost structure presented in the table...
(7,90) Chairs per day AVC AFC 2 3 Labour (workers per day) a) The marginal cost...
 (7,90) Chairs per day AVC AFC 2 3 Labour (workers per day) a) The marginal cost curve first declines and then increases because of The decline in the gap between ATC and AVC as output expands Constant marginal revenue Increasing, then diminishing, marginal utility Increasing, then diminishing, marginal returns b) The vertical distance between ATC and AVC measures Marginal cost Economic profit per unit Average fixed cost Total fixed cost c) When the marginal cost curve lies above the AVC...
SECTION marginal cost (MC) in the tah. PRINT LAST NAME, FIRST NAME SHORT-RUN COSTS Fall in...
 SECTION marginal cost (MC) in the tah. PRINT LAST NAME, FIRST NAME SHORT-RUN COSTS Fall in the missing alufer total cost ), total fixed cost (TFC), total variable bel below, use the data to fill in the blanks. al cost (ATC), average variable cost (AVC), and marginal cost (MC) AFC AVC MC TVC ATC OTC TFC 0 560 SLO IS 2 S120 s Ass 60 $68 Total fixed costs are equal to 1)S COD , regardless of how much output...
Find FC, VC, TC, AFC, AVC, ATC, and MC from the following table. Capital costs $50 per unit, and two units of capital a...
 Find FC, VC, TC, AFC, AVC, ATC, and MC from the following table. Capital costs $50 per unit, and two units of capital are used in the short run. Labor costs $20 per unit. 7. Total Cost Average Average Marginal Variable Cost |(MC) Fixed Units of Units of Variable Average Fixed Labor (L) Cost (FC) Cost (VC) (TC) Total Cost Output (ATC) (Q) Cost Cost (AFC) (AVC) 0 0 1 2 2 4 3 6 4 8 10
Question 3 (1 point) Saved 3. Which of the following statements is CORRECT? Question 3 options:...
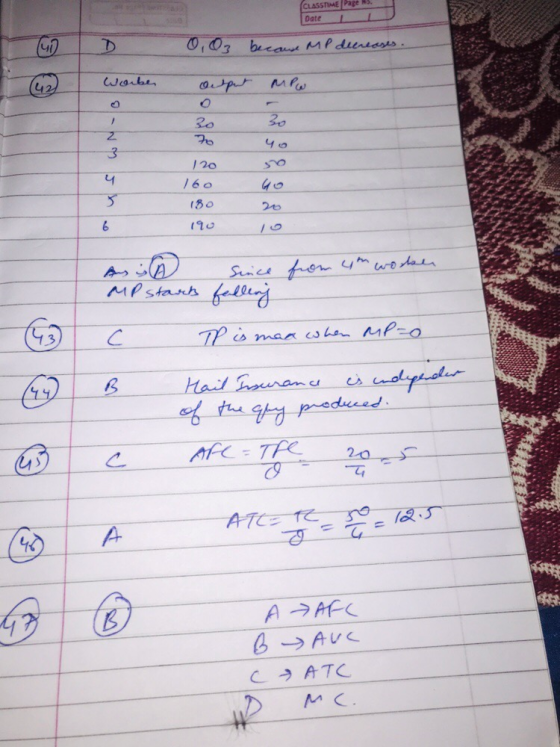
Question 3 (1 point) Saved 3. Which of the following statements is CORRECT? Question 3 options: AFC = ATC + AVC AVC = AFC - ATC ATC = AVC - AFC ATC = AFC + AVC Question 4 (1 point) Saved 4. The above table shows the total product of producing baseball hats. The marginal product of the 4th worker is equal to Question 4 options: 25 baseball hats 6.25 baseball hats 21 baseball hats 7 baseball hats Question 5...
In class A7 - Productivity and Costs (Chapter 11) 1. Calculate the Average Product and Marginal...
 In class A7 - Productivity and Costs (Chapter 11) 1. Calculate the Average Product and Marginal Product of the variable input Inputs No. of Average Marginal boats Product Product Labour of Draw the AP and MP curves of the variable input. Remember AP and MP are measured in units of output! Identify the max point of AP of Labour and MP of Labour (the points of diminishing returns for both curves). The diagram need not be to scale. 2. The...
 Question 2 [6 points] Afirm's average cost curves are shown below 120 AFC 105 ATC 90 75- 60 45 30 15 0 6 Labour (workers per day) a) The marginal cost curve first declines and then increases because of Constant marginal revenue The decline in the gap between ATC and AVC as output expands Increasing. then diminishing, marginal utility Increasing, then diminishing. marginal retuns b) The vertical distance between ATC and AVC measures Average fixed oost Economic profit per unit...
 D Question 7 1 pts Use the following graph that shows the marginal cost (MC) curve, the Average Variable Cost (AVC) curve, and the Average Total Cost (ATC) curve. What is the variable cost when the quantity (Q) being produced is 6? P MC ATC /AVC $15 $11 $8 Q O $66 $8 O $15 $11 Question 8 1 pts Use the following graph that shows the marginal cost (MC) curve, the Average Variable Cost (AVC) curve, and the Average...
 pogu u (a) Calculate the fixed cost (FC), average fixed cost (AFC), average variable cost (AVC), average total cost (ATC) and marginal cost (MC) from the table below. Units of output Total cost AFC ATC FC 50 AVC 0 0 MC 0 0 80 128 180 280 405 (b) Draw graphs to plot these cost curves against output. (c) Explain what these shapes tell us about returns and efficiency.
 Finish the table.
MPL: Marginal production of labor
TC: Total cost
MC: Marginal Cost
AFC: Average fixed cost
AVC: Average variable cost
ATC: Average total cost
lormal text - Times New... - 12 B I VA G E A E 1 E- Labor Week 6 Assignment: Production Costs 20 Points) Output MPL FC VC TC MC AFC AVC ATC (Q) 0 25 WN 25 50 75 100 13 25 15 F 16 25 125 1. Complete the table above. (4...
Finish the table.
MPL: Marginal production of labor
TC: Total cost
MC: Marginal Cost
AFC: Average fixed cost
AVC: Average variable cost
ATC: Average total cost
lormal text - Times New... - 12 B I VA G E A E 1 E- Labor Week 6 Assignment: Production Costs 20 Points) Output MPL FC VC TC MC AFC AVC ATC (Q) 0 25 WN 25 50 75 100 13 25 15 F 16 25 125 1. Complete the table above. (4...
 MC TVC AFC AVC ATC TC Output TFC $500 $200 1 2 $800 $75 $875 $925 $75 100 Refer to an above table. What is the average variable cost of producing three units of the output? $291.67 o $125 $100 $166.67 问题3 29 问题3 AVC ATC MC AFC Output TVC TC TFC $500 $200 $800 2 $75 $875 4 $925 5 100 $75 Which of the following is correct for this firm with the cost structure presented in the table...
 (7,90) Chairs per day AVC AFC 2 3 Labour (workers per day) a) The marginal cost curve first declines and then increases because of The decline in the gap between ATC and AVC as output expands Constant marginal revenue Increasing, then diminishing, marginal utility Increasing, then diminishing, marginal returns b) The vertical distance between ATC and AVC measures Marginal cost Economic profit per unit Average fixed cost Total fixed cost c) When the marginal cost curve lies above the AVC...
 SECTION marginal cost (MC) in the tah. PRINT LAST NAME, FIRST NAME SHORT-RUN COSTS Fall in the missing alufer total cost ), total fixed cost (TFC), total variable bel below, use the data to fill in the blanks. al cost (ATC), average variable cost (AVC), and marginal cost (MC) AFC AVC MC TVC ATC OTC TFC 0 560 SLO IS 2 S120 s Ass 60 $68 Total fixed costs are equal to 1)S COD , regardless of how much output...
 Find FC, VC, TC, AFC, AVC, ATC, and MC from the following table. Capital costs $50 per unit, and two units of capital are used in the short run. Labor costs $20 per unit. 7. Total Cost Average Average Marginal Variable Cost |(MC) Fixed Units of Units of Variable Average Fixed Labor (L) Cost (FC) Cost (VC) (TC) Total Cost Output (ATC) (Q) Cost Cost (AFC) (AVC) 0 0 1 2 2 4 3 6 4 8 10
 In class A7 - Productivity and Costs (Chapter 11) 1. Calculate the Average Product and Marginal Product of the variable input Inputs No. of Average Marginal boats Product Product Labour of Draw the AP and MP curves of the variable input. Remember AP and MP are measured in units of output! Identify the max point of AP of Labour and MP of Labour (the points of diminishing returns for both curves). The diagram need not be to scale. 2. The...
Most questions answered within 3 hours.
-
A manufacturing company preparing to build a new plant is
considering three potential locations for it....
asked 28 minutes ago -
A .15kg rubber ball is bounced off a wall. Before hitting the
wall, the ball moves...
asked 26 minutes ago -
B. If compound Y has approximately the same values of solubility
in toluene as compound X,...
asked 1 hour ago -
Oscar Inc. has inventory in Japan valued at 39,051,000 Yen one
year ago. One year ago...
asked 1 hour ago -
If Canada suffered from "fundamental disequilibrium," and its
government choose not to devalue its currency, a...
asked 1 hour ago -
4. How many input & output Key Value Pairs are passed into,
and emitted out of...
asked 1 hour ago -
Why would your heart not function well if constructed of
skeletal muscle? What is the particular...
asked 1 hour ago -
Please respond to this essay question in full essay form for
Chemistry 1102 Organic and Biochemistry:...
asked 1 hour ago -
Determine the head loss and velocity of flow in a water supply main
of 15.0 cm...
asked 1 hour ago -
A marketing executive who knowingly authorizes a shoddy
defective product to be brought to market is...
asked 1 hour ago -
Write a psudocode:
1. Define a function called authorize that takes in 2 strings,
uName, and...
asked 1 hour ago -
What Hall voltage (in mV) is produced by a 0.180 T field applied
across a 2.60...
asked 1 hour ago