What is the relationship between the price of crude oil and the price you pay at...
What is the relationship between the price of crude oil and the price you pay at the pump for gasoline? The accompanying table shows the prices of crude oil and the price you pay at the pump for 24 consecutive months. Complete parts (a) through (h) below.
Month Crude_Oil Gasoline
1 75 1.858
2 76 1.477
3 75 1.372
4 76 1.204
5 75 2.344
6 75 2.424
7 78 1.399
8 81 1.296
9 74 1.496
10 79 1.196
11 81 1.204
12 78 2.213
13 79 2.073
14 80 2.184
15 82 2.281
16 83 2.039
17 81 2.647
18 78 2.585
19 74 2.881
20 79 2.766
21 83 2.696
22 84 3.205
23 84 3.006
24 85 3.272
part a) Construct a scatter plot with the crude oil cost (in dollars) on the horizontal axis and the gasoline cost (in dollars per gallon) on the vertical axis. Choose the correct graph below.
part b) Use the least-squares method to develop a simple linear regression equation to predict the gasoline prices using the average crude oil cost as the independent variable. (explain how to find using phstat)
part c) Interpret the meaning of the slope, b1, in this problem.
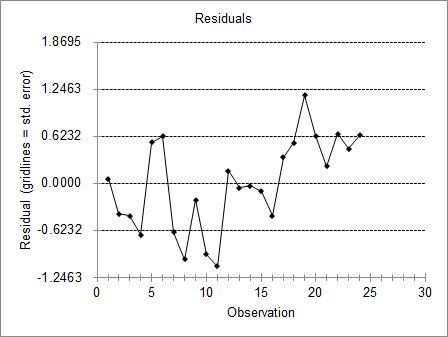
part D) Plot the residuals versus the time period.
part e) Compute the Durbin-Watson statistic. (on PHSTAT)
part f) At the 0.05 level of significance, is there evidence of positive autocorrelation among the residuals?
part g) Based on the results of (d) through (f), is there reason to question the validity of the model?
part H) What conclusions can you reach concerning the relationship between the price of a barrel of crude oil and the price of a gallon of gasoline?
Homework Answers
We will do this problem with the help of Excel.
part a) Construct a scatter plot with the crude oil cost (in dollars) on the horizontal axis and the gasoline cost (in dollars per gallon) on the vertical axis. Choose the correct graph below.
Load the data into Excel.
Go to Data>Megastat.
Select the option Correlation/Regression and go to Scatterplot.
Select crude oil cost as the horizontal axis.
Select gasoline cost as the vertical axis.
Click OK.
The output will be as follows:

part b) Use the least-squares method to develop a simple linear regression equation to predict the gasoline prices using the average crude oil cost as the independent variable. (explain how to find using phstat)
From the scatterplot, we have the simple linear regression equation:
y = -4.464 + 0.084*x
Or
Gasoline Cost = -4.464 + 0.084*Crude Oil Cost
part c) Interpret the meaning of the slope, b1, in this problem.
A simple linear regression equation has a form:
y = b0 + b1*x
We have our simple linear regression equation:
y = -4.464 + 0.084*x
b1 = 0.084
This means that for an increase in every one dollar of Crude oil, Gasoline cost will increase by 0.084 dollars.
part D) Plot the residuals versus the time period.
Load the data into Excel.
Go to Data>Megastat.
Select the option Correlation/Regression and go to Scatterplot.
Select crude oil cost as the independent variable, x.
Select gasoline cost as the dependent variable, y.
Select Plot residuals by observation.
Click OK.
The output will be as follows:
As HOMEWORKLIB answering guide, we have the option to answer only the first four sub-parts of a question when there are more than four parts. If you want me to answer the rest of the parts, please post the question in a new post. Thank You!
Add Answer to:
What is the relationship between the price of crude oil and the
price you pay at...
Pump prices slide as crude oil falls to six-year low The average price for regular gasoline...
 Pump prices slide as crude oil falls to six-year low The average price for regular gasoline at U.S. pumps fell almost 4 cents in March to $2.50 a gallon. The price of crude oil dropped to $43.46 per barrel on March 17, the lowest since March 2009 Source: Bloomberg Business, March 23, 2015 Explain the effect of a lower crude oil price on the supply of gasoline. A fall in the price of crude oil will O A. lower the...
Consider the below matrixA, which you can copy and paste directly into Matlab.
Problem #1: Consider the below matrix A, which you can copy and paste directly into Matlab. The matrix contains 3 columns. The first column consists of Test #1 marks, the second column is Test # 2 marks, and the third column is final exam marks for a large linear algebra course. Each row represents a particular student.A = [36 45 75 81 59 73 77 73 73 65 72 78 65 55 83 73 57 78 84 31 60 83...
1. Forecast demand for Year 4. a. Explain what technique you utilized to forecast your demand....
 1. Forecast demand for Year 4.
a. Explain what technique you utilized to forecast your
demand.
b. Explain why you chose this technique over others.
Year 3 Year 1 Year 2 Actual Actual Actual Forecast Forecast Forecast Demand Demand Demand Week 1 52 57 63 55 66 77 Week 2 49 58 68 69 75 65 Week 3 47 50 58 65 80 74 Week 4 60 53 58 55 78 67 57 Week 5 49 57 64 76 77...
1. Forecast demand for Year 4.
a. Explain what technique you utilized to forecast your
demand.
b. Explain why you chose this technique over others.
Year 3 Year 1 Year 2 Actual Actual Actual Forecast Forecast Forecast Demand Demand Demand Week 1 52 57 63 55 66 77 Week 2 49 58 68 69 75 65 Week 3 47 50 58 65 80 74 Week 4 60 53 58 55 78 67 57 Week 5 49 57 64 76 77...
6. A bank with a branch located in Crown Point wants to develop an improved process...
 6. A bank with a branch located in Crown Point wants to develop an improved process for serving customers during the noon-to-lpm lunch period. Management decides to first study the waiting time of the current process. Data is collected from a random sample of 15 customer and their waiting time is recorded (in minutes) and is located in the Excel data file for this assignment under the tab CPBank. For comparative purposes, similar data is collected from a bank in...
Student stress at final exam time comes partly from the uncertainty of grades and the consequence...
 Student stress at final exam time comes partly from the
uncertainty of grades and the consequences of those grades. Can
knowledge of a midterm grade be used to predict a final exam grade?
A random sample of 200 BCOM students from recent years was taken
and their percentage grades on assignments, midterm exam, and final
exam were recorded. Let’s examine the ability of midterm and
assignment grades to predict final exam grades.
The data are shown here:
Assignment
Midterm
FinalExam...
Student stress at final exam time comes partly from the
uncertainty of grades and the consequences of those grades. Can
knowledge of a midterm grade be used to predict a final exam grade?
A random sample of 200 BCOM students from recent years was taken
and their percentage grades on assignments, midterm exam, and final
exam were recorded. Let’s examine the ability of midterm and
assignment grades to predict final exam grades.
The data are shown here:
Assignment
Midterm
FinalExam...
Insurance companies track life expectancy information to assist in determining the cost of life insurance policies....
Insurance companies track life expectancy information to assist in determining the cost of life insurance policies. The insurance company knows that, last year, the life expectancy of its policy holders was 77 years. They want to know if their clients this year have a longer life expectancy, on average, so the company randomly samples some of the recently paid policies to see if the mean life expectancy of policy holders has increased. The insurance company will only change their premium...
89 67 84 74 58 51 63 68 84 65 57 76 58 75 72 67...
 89
67
84
74
58
51
63
68
84
65
57
76
58
75
72
67
64
74
95
53
77
86
90
80
70
67
76
62
91
70
63
78
49
61
77
57
83
67
107
67
80
73
94
80
73
74
67
72
68
79
73
121
63
77
70
61
75
66
79
54
76
86
84
72
65
75
63
91
72
64
99
81
58
70
58
58
90
66
64
80...
89
67
84
74
58
51
63
68
84
65
57
76
58
75
72
67
64
74
95
53
77
86
90
80
70
67
76
62
91
70
63
78
49
61
77
57
83
67
107
67
80
73
94
80
73
74
67
72
68
79
73
121
63
77
70
61
75
66
79
54
76
86
84
72
65
75
63
91
72
64
99
81
58
70
58
58
90
66
64
80...
Economists wish to look at the relationship between the price of regular unleaded gasoline in the U.S. (units-$/gallon) and the acquisition cost of OPEC crude oil (units-$10/barrel). Summary me...
 Economists wish to look at the relationship between the price of regular unleaded gasoline in the U.S. (units-$/gallon) and the acquisition cost of OPEC crude oil (units-$10/barrel). Summary measures for a random sample of 13 years are given below 13 29.3 70.39 60.5 329.67 143.61 What is the estimated regression equation? (Specify which variable is y and which is x) Question 1 where ce of gas t of Question 2 Show the ANOVA table MS df Regression Error Total Question...
Economists wish to look at the relationship between the price of regular unleaded gasoline in the...
Economists wish to look at the relationship between the price of regular unleaded gasoline in the U.S. (units=$/gallon) and the acquisition cost of OPEC crude oil (units=$10/barrel). Summary measures for a random sample of 13 years are given below. n= 13 ?yi= 31.5 ?y2i= 80.95 ?xi= 60.5 ?x2i= 329.67 ?xiyi= 156.98 What is the Lower and upper end points for 95% confidence interval for the mean value of y when x0=2.9 (with appropriate units)? . If x0=1.7, what is the...
Write a program to calculate students’ average test scores and their grades. You may assume the...
Write a program to calculate students’ average test scores and their grades. You may assume the following data: Johnson 85 83 77 91 76 Aniston 80 90 95 93 48 Cooper 78 81 11 90 73 Gupta 92 83 30 69 87 Blair 23 45 96 38 59 Clark 60 85 45 39 67 Kennedy 77 31 52 74 83 Bronson 93 94 89 77 97 Sunny 79 85 28 93 82 Smith 85 72 49 75 63 Use three...
 Pump prices slide as crude oil falls to six-year low The average price for regular gasoline at U.S. pumps fell almost 4 cents in March to $2.50 a gallon. The price of crude oil dropped to $43.46 per barrel on March 17, the lowest since March 2009 Source: Bloomberg Business, March 23, 2015 Explain the effect of a lower crude oil price on the supply of gasoline. A fall in the price of crude oil will O A. lower the...
 1. Forecast demand for Year 4.
a. Explain what technique you utilized to forecast your
demand.
b. Explain why you chose this technique over others.
Year 3 Year 1 Year 2 Actual Actual Actual Forecast Forecast Forecast Demand Demand Demand Week 1 52 57 63 55 66 77 Week 2 49 58 68 69 75 65 Week 3 47 50 58 65 80 74 Week 4 60 53 58 55 78 67 57 Week 5 49 57 64 76 77...
1. Forecast demand for Year 4.
a. Explain what technique you utilized to forecast your
demand.
b. Explain why you chose this technique over others.
Year 3 Year 1 Year 2 Actual Actual Actual Forecast Forecast Forecast Demand Demand Demand Week 1 52 57 63 55 66 77 Week 2 49 58 68 69 75 65 Week 3 47 50 58 65 80 74 Week 4 60 53 58 55 78 67 57 Week 5 49 57 64 76 77...
 6. A bank with a branch located in Crown Point wants to develop an improved process for serving customers during the noon-to-lpm lunch period. Management decides to first study the waiting time of the current process. Data is collected from a random sample of 15 customer and their waiting time is recorded (in minutes) and is located in the Excel data file for this assignment under the tab CPBank. For comparative purposes, similar data is collected from a bank in...
 Student stress at final exam time comes partly from the
uncertainty of grades and the consequences of those grades. Can
knowledge of a midterm grade be used to predict a final exam grade?
A random sample of 200 BCOM students from recent years was taken
and their percentage grades on assignments, midterm exam, and final
exam were recorded. Let’s examine the ability of midterm and
assignment grades to predict final exam grades.
The data are shown here:
Assignment
Midterm
FinalExam...
Student stress at final exam time comes partly from the
uncertainty of grades and the consequences of those grades. Can
knowledge of a midterm grade be used to predict a final exam grade?
A random sample of 200 BCOM students from recent years was taken
and their percentage grades on assignments, midterm exam, and final
exam were recorded. Let’s examine the ability of midterm and
assignment grades to predict final exam grades.
The data are shown here:
Assignment
Midterm
FinalExam...
 89
67
84
74
58
51
63
68
84
65
57
76
58
75
72
67
64
74
95
53
77
86
90
80
70
67
76
62
91
70
63
78
49
61
77
57
83
67
107
67
80
73
94
80
73
74
67
72
68
79
73
121
63
77
70
61
75
66
79
54
76
86
84
72
65
75
63
91
72
64
99
81
58
70
58
58
90
66
64
80...
89
67
84
74
58
51
63
68
84
65
57
76
58
75
72
67
64
74
95
53
77
86
90
80
70
67
76
62
91
70
63
78
49
61
77
57
83
67
107
67
80
73
94
80
73
74
67
72
68
79
73
121
63
77
70
61
75
66
79
54
76
86
84
72
65
75
63
91
72
64
99
81
58
70
58
58
90
66
64
80...
 Economists wish to look at the relationship between the price of regular unleaded gasoline in the U.S. (units-$/gallon) and the acquisition cost of OPEC crude oil (units-$10/barrel). Summary measures for a random sample of 13 years are given below 13 29.3 70.39 60.5 329.67 143.61 What is the estimated regression equation? (Specify which variable is y and which is x) Question 1 where ce of gas t of Question 2 Show the ANOVA table MS df Regression Error Total Question...
Most questions answered within 3 hours.
-
What is the mechanism of phthalic acid and m-xylene which
results in 2-(2,4-dimethylbenzoyl) benzoic acid ?...
asked 2 minutes ago -
describe business writing is
audience oriented
purposeful
Economical
asked 4 minutes ago -
Please explain how to solve these problems without using
excel.
A zero coupon bond has a...
asked 10 minutes ago -
Choose a disease that is caused by a defect in cell signaling.
Explain the cause of...
asked 10 minutes ago -
Oxford Company has limited funds available for investment and
must ration the funds among four competing...
asked 13 minutes ago -
Put your name on the first line in camelCase. Write a JavaScript
function to generate a...
asked 24 minutes ago -
Chapter 7 Telecommunications, the Internet, and Wireless
Technology:
Discuss some of the Internet services available to...
asked 26 minutes ago -
1. The college bookstore tells prospective students
that the average cost of its textbooks is $52...
asked 28 minutes ago -
A 2.5 kg block rests on a 30 ∘ slope and is attached by a string...
asked 38 minutes ago -
In C++ code language please:
1. Created a linked list
2. Insert 5 values: 1, 10,...
asked 42 minutes ago -
By analogy with automobiles, defects in cancer critical genes
have been likened to broken brakes and...
asked 1 hour ago -
Supposing Delta is an example of a very large US commercial
airline, how does the magnitude...
asked 1 hour ago