


Homework Answers
a). B option is correct.
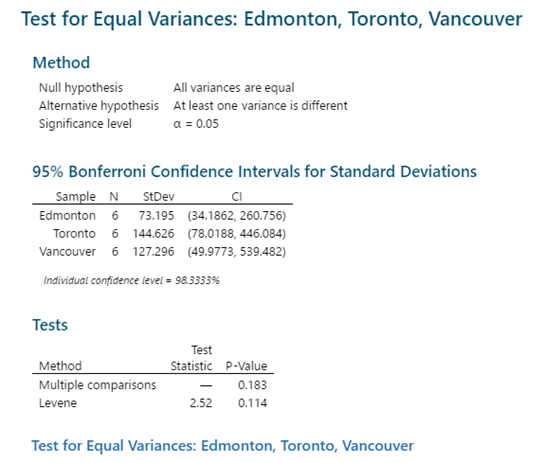
Null, All means are equal
Alternate - Not all means are equal/atleast one of mean is different.
b).
Yes all the three type of data follows normality.
Below is the minitab output of normality test.
Since for all p-value > 0.05, data follows normal distribution

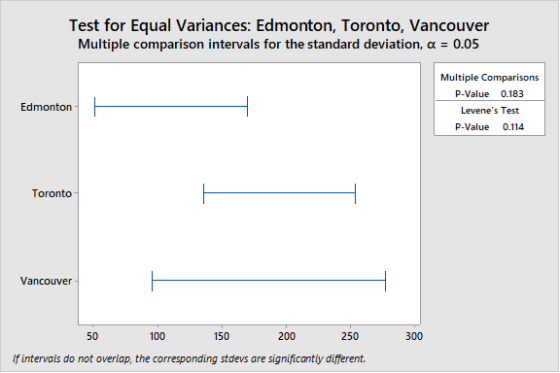
c). Yes.
i). 2,.52
ii).0.114
d).

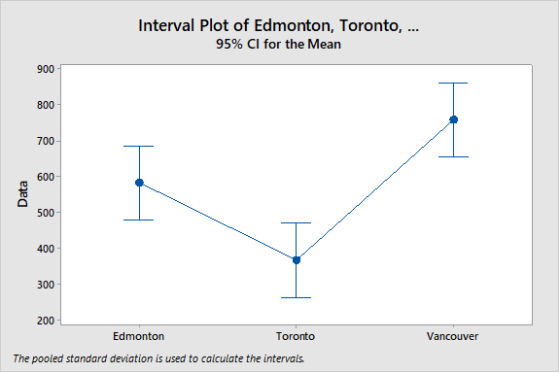
e). yes, there is significant difference between three major cities. since p-value is < 0.05.
f).


iii).

g).
i). Yes, there is significant difference
ii). No
iii). Yes, there is significant difference
Vancouver is largest.
Add Answer to:
(1 point) Family transportation costs are usually higher than most people believe. Eighteen randomly selected families...
(1 point) Suppose theorists believe that training warehouse workers can reduce absenteeism. Suppo...
 (1 point) Suppose theorists believe that training warehouse
workers can reduce absenteeism. Suppose an experimental design is
structured to test this belief. Warehouses in which training
sessions have been held for workers are selected for the study. The
four types of warehouses are (1) general merchandise, (2)
commodity, (3) bulk storage, and (4) cold storage. The training
sessions are differentiated by length. Researchers identify three
levels of training sessions according to the length of sessions:
(1) 1-20 days, (2) 21-50...
(1 point) Suppose theorists believe that training warehouse
workers can reduce absenteeism. Suppose an experimental design is
structured to test this belief. Warehouses in which training
sessions have been held for workers are selected for the study. The
four types of warehouses are (1) general merchandise, (2)
commodity, (3) bulk storage, and (4) cold storage. The training
sessions are differentiated by length. Researchers identify three
levels of training sessions according to the length of sessions:
(1) 1-20 days, (2) 21-50...
62, two independent samples of n1 = 8 and n2 = 10 were taken. The data is given below. Both populations are (1 point...
 62, two independent samples of n1 = 8 and n2 = 10 were taken. The data is given below. Both populations are (1 point) In a test of two population means - M1 versus u2 - with unknown variances o normally distributed. Sample From Population 1: 15, 19, 20, 20, 22, 18, 17, 14 Sample From Population 2:11, 14, 15, 23, 25, 12, 20, 14, 22, 17 (a) You wish to test the hypothesis that both populations have the same...
3. The table to the right shows the cost per ounce (in dollars) for a random...
 3. The table to the right shows the cost per ounce (in dollars) for a random sample of toothpastes exhibiting very good stain removal, goad stain removal, and fair stain removal. At α= 0.01, can you conclude that the mean costs per ounce are different? Perform a one-way ANOVA test by completing parts a through d. Assume that each sample is drawn from a normal population, that the samples are independent of each other, and that the populations have the...
A survey investigated how many pounds heavier respondents were than their perceived ideal weight. Consider the...
 A survey investigated how many pounds heavier respondents were than their perceived ideal weight. Consider the following data for the two-factor experiment as shown to the right. Complete parts a through a. Determine if there is interaction between Region and Gender. Use the p-value approach and a significance le Find the hypotheses. Choose the correct answer below. O A. Ho Region and Gender do not interact to affect the mean response HA Region and Gender do interact to affect the...
A survey investigated how many pounds heavier respondents were than their perceived ideal weight. Consider the...
 A survey investigated how many pounds heavier respondents were than their perceived ideal weight. Consider the following data for the two-factor experiment as shown to the right. Complete parts a through c. Gender Men West 15 13 19 13 Region Midwest South Northeast 20 19 18 16 20 15 24 19 17 20 13 18 Women a. Determine if there is interaction between Region and Gender. Use the p-value approach and a significance level of 0.05 Find the hypotheses. Choose...
To test whethoer the mean time needed to mix a batch of materlal is the same...
 To test whethoer the mean time needed to mix a batch of materlal is the same for machines produced by three manufacturers, a chemical company obtained the follewing data on the time (is misutes) needed to mix the material Manufacturer 1 2 3 19 28 19 27 26 20 23 32 23 23 30 (a) Use these data to test whether the population mean times for mbing a batch of material differ for the three manufacturers. Use e0.05 State the...
1) Rock-paper-scissors is a hand game played by two or more people where players choose to...
1) Rock-paper-scissors is a hand game played by two or more people where players choose to sign either rock',rock′,paper', or `scissors' with their hands. We would like to test if players choose between these three options randomly, or if certain options are favored above others. What hypothesis test should we conduct to answer this research question? Compare two means Compare two proportions Chi square test of goodness of fit Chi square test of independence 2) 6.43 Rock-paper-scissors: Rock-paper-scissors is a...
2) The results of a survey comparing the costs of staying one night in a full-service hotel [incl...
 Part A and B are done, kindly do part
C
2) The results of a survey comparing the costs of staying one night in a full-service hotel [including food, beverages, and telephone calls, but not taxes or gratuities) for several major cities are given in the following table. An Excel version of this data set is available on Blackboard (File: Hotel Prices) Los Angeles 240 250 230 245 235 New York 300 320 325 350 275 Atlanta HoustonPhoenix 190 198...
Part A and B are done, kindly do part
C
2) The results of a survey comparing the costs of staying one night in a full-service hotel [including food, beverages, and telephone calls, but not taxes or gratuities) for several major cities are given in the following table. An Excel version of this data set is available on Blackboard (File: Hotel Prices) Los Angeles 240 250 230 245 235 New York 300 320 325 350 275 Atlanta HoustonPhoenix 190 198...
Q7) A hypothesis test is to be performed with a Null hypothesis and an alternative hypothesis , the...
Q7) A hypothesis test is to be performed with a Null hypothesis and an alternative hypothesis , the population standard deviation is σ=3.0, the sample size is 30, and the significance level is α=0.025. What is a type I error? (1 mark) What is the chance of making a type I error in the above test? (1 mark) What is a Type II error? (1 mark) What value would the sample mean have to be greater than to reject Ho? (2 marks) It is...
1. -129 points My Notes The authors of a paper titled "Age and Violent Content Labels Make Video ...
 1. -129 points My Notes The authors of a paper titled "Age and Violent Content Labels Make Video Games Forbidden Fruits for Youth" carried out an experiment to determine if restrictive labels on video games actually increased the attractiveness of the game for young game players. Participants read a description of a new video game and were asked how much they wanted to play the game. The description also included an age rating. Some participants read the description with an...
 (1 point) Suppose theorists believe that training warehouse
workers can reduce absenteeism. Suppose an experimental design is
structured to test this belief. Warehouses in which training
sessions have been held for workers are selected for the study. The
four types of warehouses are (1) general merchandise, (2)
commodity, (3) bulk storage, and (4) cold storage. The training
sessions are differentiated by length. Researchers identify three
levels of training sessions according to the length of sessions:
(1) 1-20 days, (2) 21-50...
(1 point) Suppose theorists believe that training warehouse
workers can reduce absenteeism. Suppose an experimental design is
structured to test this belief. Warehouses in which training
sessions have been held for workers are selected for the study. The
four types of warehouses are (1) general merchandise, (2)
commodity, (3) bulk storage, and (4) cold storage. The training
sessions are differentiated by length. Researchers identify three
levels of training sessions according to the length of sessions:
(1) 1-20 days, (2) 21-50...
 62, two independent samples of n1 = 8 and n2 = 10 were taken. The data is given below. Both populations are (1 point) In a test of two population means - M1 versus u2 - with unknown variances o normally distributed. Sample From Population 1: 15, 19, 20, 20, 22, 18, 17, 14 Sample From Population 2:11, 14, 15, 23, 25, 12, 20, 14, 22, 17 (a) You wish to test the hypothesis that both populations have the same...
 3. The table to the right shows the cost per ounce (in dollars) for a random sample of toothpastes exhibiting very good stain removal, goad stain removal, and fair stain removal. At α= 0.01, can you conclude that the mean costs per ounce are different? Perform a one-way ANOVA test by completing parts a through d. Assume that each sample is drawn from a normal population, that the samples are independent of each other, and that the populations have the...
 A survey investigated how many pounds heavier respondents were than their perceived ideal weight. Consider the following data for the two-factor experiment as shown to the right. Complete parts a through a. Determine if there is interaction between Region and Gender. Use the p-value approach and a significance le Find the hypotheses. Choose the correct answer below. O A. Ho Region and Gender do not interact to affect the mean response HA Region and Gender do interact to affect the...
 A survey investigated how many pounds heavier respondents were than their perceived ideal weight. Consider the following data for the two-factor experiment as shown to the right. Complete parts a through c. Gender Men West 15 13 19 13 Region Midwest South Northeast 20 19 18 16 20 15 24 19 17 20 13 18 Women a. Determine if there is interaction between Region and Gender. Use the p-value approach and a significance level of 0.05 Find the hypotheses. Choose...
 To test whethoer the mean time needed to mix a batch of materlal is the same for machines produced by three manufacturers, a chemical company obtained the follewing data on the time (is misutes) needed to mix the material Manufacturer 1 2 3 19 28 19 27 26 20 23 32 23 23 30 (a) Use these data to test whether the population mean times for mbing a batch of material differ for the three manufacturers. Use e0.05 State the...
 Part A and B are done, kindly do part
C
2) The results of a survey comparing the costs of staying one night in a full-service hotel [including food, beverages, and telephone calls, but not taxes or gratuities) for several major cities are given in the following table. An Excel version of this data set is available on Blackboard (File: Hotel Prices) Los Angeles 240 250 230 245 235 New York 300 320 325 350 275 Atlanta HoustonPhoenix 190 198...
Part A and B are done, kindly do part
C
2) The results of a survey comparing the costs of staying one night in a full-service hotel [including food, beverages, and telephone calls, but not taxes or gratuities) for several major cities are given in the following table. An Excel version of this data set is available on Blackboard (File: Hotel Prices) Los Angeles 240 250 230 245 235 New York 300 320 325 350 275 Atlanta HoustonPhoenix 190 198...
 1. -129 points My Notes The authors of a paper titled "Age and Violent Content Labels Make Video Games Forbidden Fruits for Youth" carried out an experiment to determine if restrictive labels on video games actually increased the attractiveness of the game for young game players. Participants read a description of a new video game and were asked how much they wanted to play the game. The description also included an age rating. Some participants read the description with an...
Most questions answered within 3 hours.
-
What are the negative effects of abruptly stopping the use of
all fossil fuels? Give at...
asked 5 minutes ago -
Given that many conflict are the result of different parties having
different interests, is it possible...
asked 9 minutes ago -
A 750 g block can slide uniformly along the horizontal track
when a string attached to...
asked 12 minutes ago -
In 2017, Juan entered into a contract to write a book. The
publisher advanced Juan $50,000,...
asked 26 minutes ago -
Determine the number of kinds of protons in each molecule (w/
respect to NMR spectroscopy). Drawing...
asked 36 minutes ago -
A jeweler whose near point is 68 cm from his eye uses a
magnifying glass as...
asked 34 minutes ago -
A company wants to determine how many units of each of two
products, A and B,...
asked 38 minutes ago -
The blood pressure of a person changes throughout the day.
Suppose the systolic blood pressure of...
asked 47 minutes ago -
A chemistry student desired to study sulfur. Sulfur exhibited
the following characteristics with oxygen:
(a) It...
asked 43 minutes ago -
An Atwood machine is constructed of a solid-disk frictionless
pulley of mass m3 and radius R....
asked 45 minutes ago -
what are the advantages of lanthanum hexaboride over tungsten
filament for electron emission
what is the...
asked 46 minutes ago -
Question 5
Your uncle offers to sell you his vintage Rolls Royce. He
suggests a payment...
asked 51 minutes ago