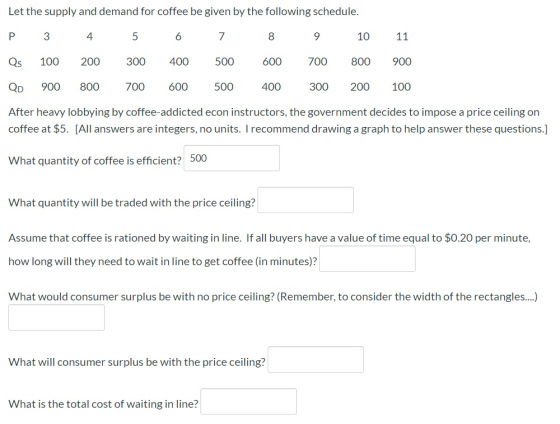
Let the supply and demand for coffee be given by the following schedule.
Homework Answers
What quantity of coffee is efficient?
500 units
This is where Qd = Qs
--
What quantity will be traded with price ceiling?
300 units
Qs = 300, Qd = 700. There will be a shortage of 400 units.
--
How long will they have to wait in line to get coffee?
At Qs = 300, buyers are willing to pay $9 per coffee. They are paying $4 less, due to the price ceiling.
Since each minute waited is worth $0.20, they are willing to wait 4 / 0.20 = 20 minutes at this price.
--
Consumer surplus before price ceiling:
CS = 1/2 x 5 x 500
CS = $1250

--
Consumer surplus after price ceiling:
The blue shaded area:
CS = [1/2 x 5 x 500] - [1/2 x 2 x 200] + [2 x 300]
CS = 1250 - 200 + 600
CS = $1650

--
Total cost of waiting in line?
The rectangle that represents the deviation between the price ceiling and the willingness to pay:
Area = [(9 - 5) x 300]
Area = $1200
Thus, the cost of waiting in line is $1200 in total.
In other words, 300 buyers are willing to wait 20 minutes each, where each minute is worth $0.20.
Add Answer to:
Let the supply and demand for coffee be given by the following
schedule.
Let the supply...
Let the supply and demand for coffee be given by the following schedule.
Let the supply and demand for coffee be given by the following schedule.P 3 4 5 6 7 8 9 10 11QS 100 200 300 400 500 600 700 800 900QD 900 800 700 600 500 400 300 200 100After heavy lobbying by coffee-addicted econ instructors, the government decides to impose a price ceiling on coffee at $5. [All answers are integers, no units. I recommend drawing a graph to help answer these questions.]What quantity of coffee is efficient?What...
Please answer question 4 to question 7. DEMAND/SUPPLY SCHEDULE 1 DEMAND/SUPPLY SCHEDULE 2 &nbs
Please answer question 4 to question 7. DEMAND/SUPPLY SCHEDULE 1 DEMAND/SUPPLY SCHEDULE 2 Price Qd Qs Qd + 200 (at each price) Qs + 200 (at each price) $50 200 800 400 1000 $45 300 700 500 900 $40 400 600 600 800 $35 500 500 700 700 $30 600 400 800 600 $25 700 300 900 500 $20 800 200 1000 400 Assume a price floor of $45 in Schedule 1; what is the result? Assume a price ceiling...
A. For the above prices and quantities: Which are the demand quantities and which are the supply quantities?
1. P Q1 Q2 500 1000 100 1000 900 200 1500 800 300 2000 700 400 2500 600 500 3000 500 600 3500 400 700 4000 300 800 4500 200 900 5000 100 1000 A. For the above prices and quantities: Which are the demand quantities and which are the supply quantities? B. Graph demand and supply on one graph. (Plot the points) C. What is the equilibrium price and quantity? Approximately. D. What would a price ceiling set at...
Consider the Bolivian market for lemons. The following graph shows the domestic demand and domestic supply...
 Consider the Bolivian market for lemons. The following graph shows the domestic demand and domestic supply curves for lemons in Bolivia. Suppose Bolivia's government currently does not allow international trade in lemons. Use the black point (plus symbol) to indicate the equilibrium price of a ton of lemons and the equilibrium quantity of lemons in Bolivia in the absence of international trade. Then, use the green triangle (triangle symbol) to shade the area representing consumer surplus in equilibrium. Finally, use...
1.) Efficiency The table below shows the supply and demand balance for the rental housing market...
 1.) Efficiency The table below shows the supply and demand balance for the rental housing market in Riyadh. Supply and Demand for Houses in Riyadh Price (SAR per m2) Quantity Quantity demanded supplied ('000 houses) 1000 900 100 800 200 600 300 400 500 400 200 600 a.) Draw the supply and demand balance of the housing market in Riyadh. What is the equilibrium price and equilibrium quantity in the market? (1.5 Point) b.) In your graph, shade in and...
The figure to the right shows the U.S. demand and supply for leather footwear. Price $50...
 The figure to the right shows the U.S. demand and supply for leather footwear. Price $50 Under autarky, the consumer surplus is US. Supply O A. $195. OB. $260. O C. $300. O D. $555. World price U.S. Demand 10 15 20 Quantity of leather footwear The figure shows the market for apartments in Springfield. Recently, the government imposed a rent ceiling of $1,000 per month. Price (dollars per month) $2,500 Supply What is the value of the portion of...
Question 3 Table 1 illustrates the demand and supply schedules for microwave sets made in AlamDunia,...
 Question 3 Table 1 illustrates the demand and supply schedules for microwave sets made in AlamDunia, a "small" nation that is unable to affect world prices. Sketch AlamDunia's demand and supply schedules of microwave sets (5 points) Table 1 Price per Qaity Quantity Microwave Demanded Supplied DD100 DD200 DD300 DD400 DD500 DD DanaDunia 900 700 500 300 100 0 200 400 600 800 Suppose that DanaDunia (DD) is AlamDunia's currency and suppose that AlamDunia imports microwave sets at a price...
Price Quantity This is an example of a binding Price Ceiling . Economists expect that a...
 Price Quantity This is an example of a binding Price Ceiling . Economists expect that a binding Price Floor will create a Surplus in a market. TOU $90 $80 $70 $60 $50 $40 $30 $20 100 200 300 400 500 600 700 800 900 1000 Quantity a.) A price ceiling of $30 will create a shortage b.) A price ceiling of $10 will create a shortage C.) A price floor of $60 will create a surplus of of of/ 300...
1. Suppose that the initial demand and supply curves for coffee are illustrate by D' and...
 1. Suppose that the initial demand and supply curves for coffee are illustrate by D' and St in the graph below. Assume that coffee and kringle are complements in consumption. Clearly label all additions to the graph. a) Suppose that the initial market price of coffee, Po, is $1 per cup (Po = $1). Determine and illustrate the quantity demanded at Po (labeled as Qc), and the quantity supplied at Po (labeled as Qoʻ). Show Qoand Qos on the quantity...
Happyland is the only theme park in the nation. The table sets out the demand schedule for passes and the cost schedule for running the theme park. At the market equilibrium, no children und...
 Happyland is the only theme park in the nation.
The table sets out the demand schedule for passes and the cost
schedule for running the theme park.
At the market equilibrium, no children under 10 years old
visit the theme park.
Happyland offers children a discount of 50 percent, which
brings in more families.
This discount ______ consumer surplus and ______ producer
surplus.
A.
decreases; increases
B.
increases; increases
C.
increases; decreases
D.
decreases; decreases
Happyland is ▼ more/less(choose)...
Happyland is the only theme park in the nation.
The table sets out the demand schedule for passes and the cost
schedule for running the theme park.
At the market equilibrium, no children under 10 years old
visit the theme park.
Happyland offers children a discount of 50 percent, which
brings in more families.
This discount ______ consumer surplus and ______ producer
surplus.
A.
decreases; increases
B.
increases; increases
C.
increases; decreases
D.
decreases; decreases
Happyland is ▼ more/less(choose)...
 Consider the Bolivian market for lemons. The following graph shows the domestic demand and domestic supply curves for lemons in Bolivia. Suppose Bolivia's government currently does not allow international trade in lemons. Use the black point (plus symbol) to indicate the equilibrium price of a ton of lemons and the equilibrium quantity of lemons in Bolivia in the absence of international trade. Then, use the green triangle (triangle symbol) to shade the area representing consumer surplus in equilibrium. Finally, use...
 1.) Efficiency The table below shows the supply and demand balance for the rental housing market in Riyadh. Supply and Demand for Houses in Riyadh Price (SAR per m2) Quantity Quantity demanded supplied ('000 houses) 1000 900 100 800 200 600 300 400 500 400 200 600 a.) Draw the supply and demand balance of the housing market in Riyadh. What is the equilibrium price and equilibrium quantity in the market? (1.5 Point) b.) In your graph, shade in and...
 The figure to the right shows the U.S. demand and supply for leather footwear. Price $50 Under autarky, the consumer surplus is US. Supply O A. $195. OB. $260. O C. $300. O D. $555. World price U.S. Demand 10 15 20 Quantity of leather footwear The figure shows the market for apartments in Springfield. Recently, the government imposed a rent ceiling of $1,000 per month. Price (dollars per month) $2,500 Supply What is the value of the portion of...
 Question 3 Table 1 illustrates the demand and supply schedules for microwave sets made in AlamDunia, a "small" nation that is unable to affect world prices. Sketch AlamDunia's demand and supply schedules of microwave sets (5 points) Table 1 Price per Qaity Quantity Microwave Demanded Supplied DD100 DD200 DD300 DD400 DD500 DD DanaDunia 900 700 500 300 100 0 200 400 600 800 Suppose that DanaDunia (DD) is AlamDunia's currency and suppose that AlamDunia imports microwave sets at a price...
 Price Quantity This is an example of a binding Price Ceiling . Economists expect that a binding Price Floor will create a Surplus in a market. TOU $90 $80 $70 $60 $50 $40 $30 $20 100 200 300 400 500 600 700 800 900 1000 Quantity a.) A price ceiling of $30 will create a shortage b.) A price ceiling of $10 will create a shortage C.) A price floor of $60 will create a surplus of of of/ 300...
 1. Suppose that the initial demand and supply curves for coffee are illustrate by D' and St in the graph below. Assume that coffee and kringle are complements in consumption. Clearly label all additions to the graph. a) Suppose that the initial market price of coffee, Po, is $1 per cup (Po = $1). Determine and illustrate the quantity demanded at Po (labeled as Qc), and the quantity supplied at Po (labeled as Qoʻ). Show Qoand Qos on the quantity...
 Happyland is the only theme park in the nation.
The table sets out the demand schedule for passes and the cost
schedule for running the theme park.
At the market equilibrium, no children under 10 years old
visit the theme park.
Happyland offers children a discount of 50 percent, which
brings in more families.
This discount ______ consumer surplus and ______ producer
surplus.
A.
decreases; increases
B.
increases; increases
C.
increases; decreases
D.
decreases; decreases
Happyland is ▼ more/less(choose)...
Happyland is the only theme park in the nation.
The table sets out the demand schedule for passes and the cost
schedule for running the theme park.
At the market equilibrium, no children under 10 years old
visit the theme park.
Happyland offers children a discount of 50 percent, which
brings in more families.
This discount ______ consumer surplus and ______ producer
surplus.
A.
decreases; increases
B.
increases; increases
C.
increases; decreases
D.
decreases; decreases
Happyland is ▼ more/less(choose)...
Most questions answered within 3 hours.
-
Perform the following calculation. Make sure to pay attention to
significant figures. Your answer should be...
asked 3 minutes ago -
10. Net Present Value
Method and Internal Rate of Return Method for a service company
Buckeye...
asked 4 minutes ago -
An air conditioner removes hot air at 35 °C and 70 % relative
humidity from the...
asked 5 minutes ago -
TRUE OR FALSE :if false please explain
protiens folds up according to thermodynamic principles into a...
asked 7 minutes ago -
Of the 28 restaurants in an area, 4 serve on one type of
cuisine, 9 serve...
asked 22 minutes ago -
Which of the following is FALSE for catabolic pathways?
They are oxidative.
They generate oxidized enzyme...
asked 37 minutes ago -
Question 3 (20 Marks)
Read the text below and answer the question
accordingly.
ABC Enterprises Cc...
asked 44 minutes ago -
How does computer technology such as patient portals
affects revenue and expenses in a healthcare
environment?
asked 45 minutes ago -
what is the most stable chair conformation for beta -
D - Mannose
asked 45 minutes ago -
Use the definition of the fact that f(x) is O(g(x)) to
show that:
1. 7x^2 is...
asked 46 minutes ago -
In view of the fact that so many marriages end in divorce, why
do you think...
asked 1 hour ago -
You are an entrepreneur starting a biotechnology firm. If your
research is successful, the technology can...
asked 1 hour ago