Unit Project: Population Analysis
Read the Overview and look at the Sample Project to understand what you will be creating. Check out the Rubric to make sure you earn every possible point. Use the Presentation Template to create the presentation you will submit. Use the spreadsheet template to organize your data and create your scatter plots.
All of the files can be found in this Google Drive folder. The files are Microsoft Office files. You can download them to use with MS Office or you can open them in the corresponding Google program.
Excel = Google Sheets
Word = Google Docs
PowerPoint = Google Slides
__________________________________________________________________
Population Analysis
by
Exploring the Population of
[State or County]
Population Data: [Name of County]
Year Population
1900 ______
1910 ______
1920 ______
1930 ______
1940 ______
1950 ______
1960 ______
1970 ______
1980 ______
1990 ______
2000 ______
2010 ______
___________________________________________________________________
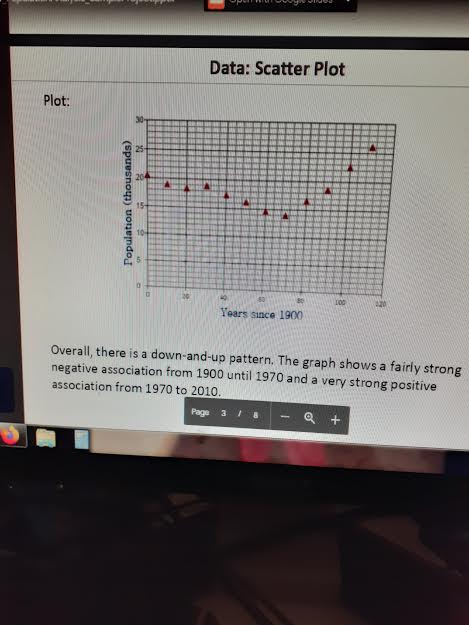
Data: Scatter Plot
Plot:
[Discussion]
___________________________________________________________________
Linear Model
Plot:
[Discussion]
______________________________________________________________
Quadratic Model
Plot:
[Discussion]
_________________________________________________________________
Exponential Model
Plot:
[Discussion]
_________________________________________________________________
Prediction
Regression model: [y = mx + b or y = ax2 + bx + c or y = a · bx]
This model allows me to predict that the population of [state or county] in [year] will be about [prediction].
[Discussion]
__________________________________________________________________
Reflection
[Discussion
Determine a country, state, city, or county/parish that you will use for a population study. Consider picking where you live or have lived, where you have visited, or where you would like to live or visit someday.
2. Search online to find the population counts for your chosen country, state, city, or county/parish for each year from 1900 to 2020. Try searches like "Texas population 1900" or "San Bernardino County, CA
population 1940.” Or, use the links below to choose a country, state, or city.
● Site: https://www.macrotrends.net/countries/ranking/population
● Site: https://www.macrotrends.net/states/us-states-by-population
● Site: https://www.macrotrends.net/cities/largest-cities-by-population
If your choice does not have data from 1900, it is okay to use 1950-2020.
3. Open your presentation. On slide 1, type your name and the state or county/parish you are exploring. On slide 2, complete the table with your data. Double-check that you copied all the numbers correctly.
Homework Answers
Request Answer!
We need at least 10 more requests to produce the answer.
0 / 10 have requested this problem solution
The more requests, the faster the answer.
Unit Project: Population Analysis
 Read the Overview and look at the Sample Project to understand what you will be creating. Check out the Rubric to make sure you earn every possible point. Use the Presentation Template to create the presentation you will submit. Use the spreadsheet template to organize your data and create your scatter plots.All of the files can be found in this Google Drive folder. The files are Microsoft Office files. You can download them to use with MS Office or you...
Using matlab 1. Least Square Curve Fitting: Consider the population in Bryan, TX from year 1900...
 Using matlab
1. Least Square Curve Fitting: Consider the population in Bryan, TX from year 1900 to 2010, below: 1900 1910 1920 1930 1940 1950 19601970 1980 1990 2000 2010 3,589 4,132 6,307 7,814 11,842 18,072 27,542 33,141 44,337 55,002 65,660 76,201 Using the logistic model, NoK where N() is the the population at time (years from the intial year), and No is the initial population. Find the the growth parameter rs0 and carrying capacity K>-O such that the model...
Using matlab
1. Least Square Curve Fitting: Consider the population in Bryan, TX from year 1900 to 2010, below: 1900 1910 1920 1930 1940 1950 19601970 1980 1990 2000 2010 3,589 4,132 6,307 7,814 11,842 18,072 27,542 33,141 44,337 55,002 65,660 76,201 Using the logistic model, NoK where N() is the the population at time (years from the intial year), and No is the initial population. Find the the growth parameter rs0 and carrying capacity K>-O such that the model...
Styles The data in the accompanying table represent the population of a certain country every 10 ...
 Styles The data in the accompanying table represent the population of a certain country every 10 years for the years 1900-2000. An ecologist is interested in finding an equation that describes the population of the country over time. Complete parts (a) through (3) below Year, x 1900 1910 1920 1930 1940 1950 Population, y Year, x Population, y 179,323 203,302 79,212 1960 95,228 1970 104,021 1980 123,202 1990 132,164 2000 151,325 226,542 248,709 281,421 (a)Determine the least-squares regression equation, treating...
The population of a certain country was approximately 25 million in 1900, 150 million in 1950,...
 The population of a certain country was approximately 25 million in 1900, 150 million in 1950, and 375 million in 2000, Construct a model for this data by finding a quadratic equation whose graph passes through the points (0.25),(50,150), and (100,375). Use this model to estimate the population in 2060 Let x be the number of years since 1900 and y be the population in millions y- (Use integers or decimals for any numbers in the expression) According to the...
a in in 2000, the population of a country was approximately 5.51 milion and by 2050...
 a in in 2000, the population of a country was approximately 5.51 milion and by 2050 it is projected to grow to 10 milion. Use the exponential growth model A.Ap which is the number of years after 2000 and is in millions, to find an exponential growth function that models the data. By which year will the population be 13 million? b. 2000 6,510,00 1950 1970 1900 2010 2030 2050 a. The exponential growth function that models the data is...
3-The population in the city of Houston from 1900 to 2010 is given below: Year Population...
3-The population in the city of Houston from 1900 to 2010 is given below: Year Population 1900 44,633 1910 78,800 1920 138,276 1930 292,352 1940 384,514 1950 596,163 1960 938,219 1970 1,233,505 1980 1,595,138 1990 1,631,766 2000 1,953,631 2010 2,100,263 a. Give a scatter-plot and residual plot of the data. b. Based on the graphs in part a, propose a model for the data. Show me evidence to support your conclusion. Go through all necessary steps to construct a model...
Below are two tables based on the actual populations of Raleigh, NC and Wake County, NC from 1920...
Below are two tables based on the actual populations of Raleigh, NC and Wake County, NC from 1920-1990. Using Excel, create separate tables for t versus p for the Raleigh and Wake County data. (Note: Some of these values are randomized and may not exactly match the data you have seen in the lesson.) Years since 1900 Raleigh Population (in thousands) 20 24 30 37.3 40 46.8 50 65.6 60 93.9 70 122 80 150 90 212 Years since 1900...
SHOW ALL WORK Write the converse, inverse, and contrapositive of the following conditional statement. Of these four propositions, state which pairs are logically equivalent. 6. If Jose has a family,...
 SHOW ALL WORK Write the converse, inverse, and contrapositive of the following conditional statement. Of these four propositions, state which pairs are logically equivalent. 6. If Jose has a family, then he has a father Converse Inverse Contrapositive 7. Consider US population data presented with linear trendline model (Figure and exponential model. US Population (Data &Exponential Model) US Population Estimate 350,000,000 300,000,000 250,000,000 200,000,000 150,000,000 100,000,000 50,000,000 350,000,000 00,000,000 250,000,000 200,000,000 150,000,000 100,000,000 50,000,000 0.0036e R0.9947 R2 0.9193 50,000,000]1750 18b0...
C++ ONLY The question is - The US Census Bureau gathers population information and aggregates it...
C++ ONLY The question is - The US Census Bureau gathers population information and aggregates it at the city, county and state level. A research project on population distribution in the Southeast US has acquired a data file from the Census Bureau that contains the populations of each county in Mississippi (MS) and Florida (FL). For this research project write a program that calculates the average county population for these two states. Each line in the Census Bureau data file...
can somebody please help me with the question quickly I really need help with this, choose a country and research population data in order to fill out the table below.
 2. Choose a country and research population data in order to fill out the table beloa. Copy the population numbers counted each five years, as shown in the data base, for the years from 1950 to 2000 . Add a column, \(t\), measuring years șince 1945 .b. What is the country you selected? In what part of the world is it? What is the magnitude of its population numbers? \(\left(100,000^{\circ} \mathrm{s}\right.\), millions, hundred millions, billions?) Is it growing or shrinking...
 Using matlab
1. Least Square Curve Fitting: Consider the population in Bryan, TX from year 1900 to 2010, below: 1900 1910 1920 1930 1940 1950 19601970 1980 1990 2000 2010 3,589 4,132 6,307 7,814 11,842 18,072 27,542 33,141 44,337 55,002 65,660 76,201 Using the logistic model, NoK where N() is the the population at time (years from the intial year), and No is the initial population. Find the the growth parameter rs0 and carrying capacity K>-O such that the model...
Using matlab
1. Least Square Curve Fitting: Consider the population in Bryan, TX from year 1900 to 2010, below: 1900 1910 1920 1930 1940 1950 19601970 1980 1990 2000 2010 3,589 4,132 6,307 7,814 11,842 18,072 27,542 33,141 44,337 55,002 65,660 76,201 Using the logistic model, NoK where N() is the the population at time (years from the intial year), and No is the initial population. Find the the growth parameter rs0 and carrying capacity K>-O such that the model...
 Styles The data in the accompanying table represent the population of a certain country every 10 years for the years 1900-2000. An ecologist is interested in finding an equation that describes the population of the country over time. Complete parts (a) through (3) below Year, x 1900 1910 1920 1930 1940 1950 Population, y Year, x Population, y 179,323 203,302 79,212 1960 95,228 1970 104,021 1980 123,202 1990 132,164 2000 151,325 226,542 248,709 281,421 (a)Determine the least-squares regression equation, treating...
 The population of a certain country was approximately 25 million in 1900, 150 million in 1950, and 375 million in 2000, Construct a model for this data by finding a quadratic equation whose graph passes through the points (0.25),(50,150), and (100,375). Use this model to estimate the population in 2060 Let x be the number of years since 1900 and y be the population in millions y- (Use integers or decimals for any numbers in the expression) According to the...
 a in in 2000, the population of a country was approximately 5.51 milion and by 2050 it is projected to grow to 10 milion. Use the exponential growth model A.Ap which is the number of years after 2000 and is in millions, to find an exponential growth function that models the data. By which year will the population be 13 million? b. 2000 6,510,00 1950 1970 1900 2010 2030 2050 a. The exponential growth function that models the data is...
 SHOW ALL WORK Write the converse, inverse, and contrapositive of the following conditional statement. Of these four propositions, state which pairs are logically equivalent. 6. If Jose has a family, then he has a father Converse Inverse Contrapositive 7. Consider US population data presented with linear trendline model (Figure and exponential model. US Population (Data &Exponential Model) US Population Estimate 350,000,000 300,000,000 250,000,000 200,000,000 150,000,000 100,000,000 50,000,000 350,000,000 00,000,000 250,000,000 200,000,000 150,000,000 100,000,000 50,000,000 0.0036e R0.9947 R2 0.9193 50,000,000]1750 18b0...
Most questions answered within 3 hours.
-
Fluorine-20 has a half-life of 11.0 s. If a sample initially
contains 36.0 μg of this...
asked 13 minutes ago -
How many fissions take place per second in a 190-MW reactor?
Assume 200 MeV is released...
asked 1 hour ago -
IQ scores are normally distributed with a mean of 100 and a
standard deviation of 15....
asked 1 hour ago -
You are to assess the biomechanics of a male’s arm using his
bicep to hold a...
asked 3 hours ago -
What is the maximum number of grams of N-acetyl-p-toluidine can
be prepared from 70. milliliters of...
asked 4 hours ago -
A researcher is using a two-tailed hypothesis test with α =
.05 to evaluate the effect...
asked 6 hours ago -
Two long, straight wires are parallel and 8.5 cm apart. The top
wire carries a current...
asked 7 hours ago -
Three arguments used to promote trade barriers are the national
security argument, the infant-industry argument, and...
asked 8 hours ago -
Question 3:
Percentage of Completion
Method (12 marks) On January 1, 2017, Eagle Construction Ltd.
started...
asked 8 hours ago -
A company purchased a tract of land for its natural resources at
a cost of $2,042,900....
asked 7 hours ago -
1. These financial statement item are
for UPS Company at fiscal year-end, October 31, 2019.
...
asked 8 hours ago -
PYTHON HOMEWORK
When an object is falling because of gravity, the following
formula can be used...
asked 8 hours ago