
Homework Answers
Sol:
perform ANOVA one way in excel
Install analysis tooplak in excel \
Go to
Data>Data analysis>ANOVA single factor we get
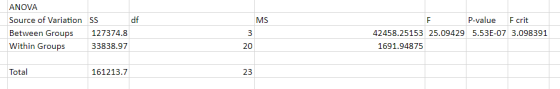
Output;

ANSWER(A)
Ho:mu1=mu2=mu3=mu4
Ha:Atleast two Mui's are unequal
OPTION (D)
ANSWER(B)
F=25.09
ANSWER(C)
p value <0.001
ANSWER(D)
Reject Ho.There is a difference in compression strengths among the four box types.
OPTION B
Add Answer to:
An article describes an experiment in which several types of boxes were compared with respect to...
An article describes an experiment in which several types of boxes were compared with respect to...
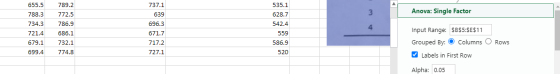
An article describes an experiment in which several types of boxes were compared with respect to compression strength (lb). The table below presents the results of a single-factor ANOVA experiment involving I = 4 types of boxes. Type of Box Compression Strength (lb) Sample Mean Sample SD 1 655.5 788.3 734.3 721.4 679.1 699.4 713.00 46.55 2 789.2 772.5 786.9 686.1 732.1 774.8 756.93 40.34 3 737.1 639.0 696.3 671.7 717.2 727.1 698.07 37.20 4 535.1 628.7 542.4 559.0 586.9...
An article describes an experiment in which several types of boxes were compared with respect to...
 An article describes an experiment in which several types of boxes were compared with respect to compression strength (lb). The table below presents the results of a single-factor ANOVA experiment involving I = 4 types of boxes. Type of Box Sample Mean Sample SD 1 Compression Strength (lb) 655.5 788.3 734.3 721.4 679.1 699.4 789.2 772.5 786.9 686.1 732.1 774.8 713.00 46.55 2 756.93 40.34 3 737.1 639.0 696.3 671.7717.2 727.1 698.07 37.20 4 535.1 628.7 542.4 559.0 586.9 520.0...
1 An article describes an experiment in which several types of boxes were compared with respect...
 1 An article describes an experiment in which several types of boxes were compared with respect to compression strength (lb). The table below presents the results of a single-factor ANOVA experiment involving I = 4 types of boxes. Type of Box Compression Strength (lb) Sample Mean Sample SD 655.5 788.3 734.3 721.4 679.1 699.4 713.00 46.55 789.2 772.5 786.9 686.1 732.1 774.8 756.93 40.34 3 737.1 639.0 696.3 671.7 717.2 727.1 698.07 37.20 4 535.1 628.7 542.4 559.0 586.9 520.0...
1. In an experiment to compare the tensile strengths of 1 - 6 different types of...
 1. In an experiment to compare the tensile strengths of 1 - 6 different types of copper wire, ) = 5 samples of each type were used. The between-samples and within samples estimates of a were computed as MSTR = 2649.3 and MSE - 1169.2, respectively. Use the F test at level 0.05 to test Ho: H1 12 - ... - versus Ha: at least two wi's are unequal Calculate the test statistic (Round your answer to two decimal places.)...
In an experiment to compare the tensile strengths of I = 6 different types of copper...
In an experiment to compare the tensile strengths of I = 6 different types of copper wire, J = 5 samples of each type were used. The between-samples and within-samples estimates of σ2 were computed as MSTr = 2678.3 and MSE = 1188.2, respectively. Use the F test at level 0.05 to test H0: μ1 = μ2 = . . . = μ6 versus Ha: at least two μi's are unequal. 1. Calculate the test statistic. (Round your answer to...
An experiment was carried out to investigate the effect of species (factor A, with I =...
 An experiment was carried out to investigate the effect of species (factor A, with I = 4) and grade (factor B, with ) = 3) on breaking strength of wood specimens. One observation was made for each species-grade combination-resulting in SSA = 444.0, SSB = 423.6, and SSE = 127.4. Assume that an additive model is appropriate. (a) Test Ho: a = a 2 = az = Q 4 = 0 (no differences in true average strength due to species)...
An experiment was carried out to investigate the effect of species (factor A, with I =...
 An experiment was carried out to investigate the effect of species (factor A, with I = 4) and grade (factor B, with ) = 3) on breaking strength of wood specimens. One observation was made for each species-grade combination-resulting in SSA = 443.0, SSB = 428.6, and SSE = 122.4. Assume that an additive model is appropriate. (a) Test Ho: a1 = a2 = 03 = 24 = 0 (no differences in true average strength due to species) versus Ha:...
Consider the accompanying data on plant growth after the application of different types of growth hormone....
Consider the accompanying data on plant growth after the application of different types of growth hormone. 1: 13 17 8 15 2: 21 12 20 17 3: 19 14 20 17 4: 8 11 18 9 5: 6 12 14 7 (a) Perform an F test at level α = 0.05. State the appropriate hypotheses. H0: μ1 = μ2 = μ3 = μ4 = μ5 Ha: all five μi's are unequal H0: μ1 = μ2 = μ3 = μ4 =...
An experiment was carried out to investigate the effect of species (factor A, with I =...
An experiment was carried out to investigate the effect of species (factor A, with I = 4) and grade (factor B, with J = 3) on breaking strength of wood specimens. One observation was made for each species—grade combination—resulting in SSA = 445.0, SSB = 429.6, and SSE = 124.4. Assume that an additive model is appropriate. (a) Test H0: α1 = α2 = α3 = α4 = 0 (no differences in true average strength due to species) versus Ha:...
=========================================== f=25.09 is wrong. Olestra is a fat substitute approved by the FDA for use in...
 ===========================================
f=25.09 is wrong.
Olestra is a fat substitute approved by the FDA for use in snack foods. Because there have been anecdotal reports of gastrointestinal problems associated with olestra consumption, a randomized, double-blind, placebo-controlled experiment was carried out to compare olestra potato chips to regular potato chips with respect to GI symptoms. Among 500 individuals in the TG control group, 16.6% experienced an adverse GI event, whereas among the 500 individuals in the olestra treatment group, 14.8% experienced such...
===========================================
f=25.09 is wrong.
Olestra is a fat substitute approved by the FDA for use in snack foods. Because there have been anecdotal reports of gastrointestinal problems associated with olestra consumption, a randomized, double-blind, placebo-controlled experiment was carried out to compare olestra potato chips to regular potato chips with respect to GI symptoms. Among 500 individuals in the TG control group, 16.6% experienced an adverse GI event, whereas among the 500 individuals in the olestra treatment group, 14.8% experienced such...
 An article describes an experiment in which several types of boxes were compared with respect to compression strength (lb). The table below presents the results of a single-factor ANOVA experiment involving I = 4 types of boxes. Type of Box Sample Mean Sample SD 1 Compression Strength (lb) 655.5 788.3 734.3 721.4 679.1 699.4 789.2 772.5 786.9 686.1 732.1 774.8 713.00 46.55 2 756.93 40.34 3 737.1 639.0 696.3 671.7717.2 727.1 698.07 37.20 4 535.1 628.7 542.4 559.0 586.9 520.0...
 1 An article describes an experiment in which several types of boxes were compared with respect to compression strength (lb). The table below presents the results of a single-factor ANOVA experiment involving I = 4 types of boxes. Type of Box Compression Strength (lb) Sample Mean Sample SD 655.5 788.3 734.3 721.4 679.1 699.4 713.00 46.55 789.2 772.5 786.9 686.1 732.1 774.8 756.93 40.34 3 737.1 639.0 696.3 671.7 717.2 727.1 698.07 37.20 4 535.1 628.7 542.4 559.0 586.9 520.0...
 1. In an experiment to compare the tensile strengths of 1 - 6 different types of copper wire, ) = 5 samples of each type were used. The between-samples and within samples estimates of a were computed as MSTR = 2649.3 and MSE - 1169.2, respectively. Use the F test at level 0.05 to test Ho: H1 12 - ... - versus Ha: at least two wi's are unequal Calculate the test statistic (Round your answer to two decimal places.)...
 An experiment was carried out to investigate the effect of species (factor A, with I = 4) and grade (factor B, with ) = 3) on breaking strength of wood specimens. One observation was made for each species-grade combination-resulting in SSA = 444.0, SSB = 423.6, and SSE = 127.4. Assume that an additive model is appropriate. (a) Test Ho: a = a 2 = az = Q 4 = 0 (no differences in true average strength due to species)...
 An experiment was carried out to investigate the effect of species (factor A, with I = 4) and grade (factor B, with ) = 3) on breaking strength of wood specimens. One observation was made for each species-grade combination-resulting in SSA = 443.0, SSB = 428.6, and SSE = 122.4. Assume that an additive model is appropriate. (a) Test Ho: a1 = a2 = 03 = 24 = 0 (no differences in true average strength due to species) versus Ha:...
 ===========================================
f=25.09 is wrong.
Olestra is a fat substitute approved by the FDA for use in snack foods. Because there have been anecdotal reports of gastrointestinal problems associated with olestra consumption, a randomized, double-blind, placebo-controlled experiment was carried out to compare olestra potato chips to regular potato chips with respect to GI symptoms. Among 500 individuals in the TG control group, 16.6% experienced an adverse GI event, whereas among the 500 individuals in the olestra treatment group, 14.8% experienced such...
===========================================
f=25.09 is wrong.
Olestra is a fat substitute approved by the FDA for use in snack foods. Because there have been anecdotal reports of gastrointestinal problems associated with olestra consumption, a randomized, double-blind, placebo-controlled experiment was carried out to compare olestra potato chips to regular potato chips with respect to GI symptoms. Among 500 individuals in the TG control group, 16.6% experienced an adverse GI event, whereas among the 500 individuals in the olestra treatment group, 14.8% experienced such...
Most questions answered within 3 hours.
-
A .15kg rubber ball is bounced off a wall. Before hitting the
wall, the ball moves...
asked 28 minutes ago -
A manufacturing company preparing to build a new plant is
considering three potential locations for it....
asked 29 minutes ago -
B. If compound Y has approximately the same values of solubility
in toluene as compound X,...
asked 1 hour ago -
Oscar Inc. has inventory in Japan valued at 39,051,000 Yen one
year ago. One year ago...
asked 1 hour ago -
If Canada suffered from "fundamental disequilibrium," and its
government choose not to devalue its currency, a...
asked 1 hour ago -
4. How many input & output Key Value Pairs are passed into,
and emitted out of...
asked 1 hour ago -
Why would your heart not function well if constructed of
skeletal muscle? What is the particular...
asked 1 hour ago -
Please respond to this essay question in full essay form for
Chemistry 1102 Organic and Biochemistry:...
asked 1 hour ago -
Determine the head loss and velocity of flow in a water supply main
of 15.0 cm...
asked 1 hour ago -
A marketing executive who knowingly authorizes a shoddy
defective product to be brought to market is...
asked 1 hour ago -
Write a psudocode:
1. Define a function called authorize that takes in 2 strings,
uName, and...
asked 1 hour ago -
What Hall voltage (in mV) is produced by a 0.180 T field applied
across a 2.60...
asked 1 hour ago