The Dean of Instruction at a local college requested that a new standardized test for an...
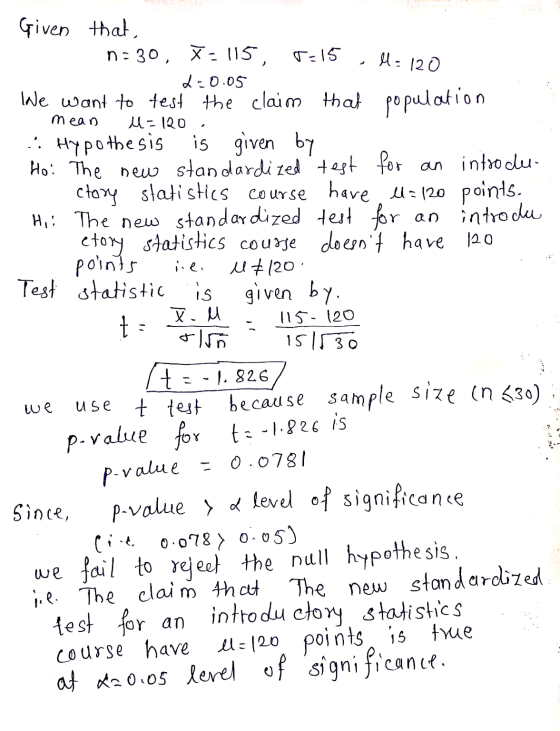
The Dean of Instruction at a local college requested that a new standardized test for an introductory statistics course be developed with the requirement that it should have µ = 120 points and σ = 15. A class of 30 students complete the new test with a mean grade of 115. Conduct a hypothesis test at α = .05 to determine whether the claim that µ = 120 can be supported. Use the p-value approach and complete the following to show how this would be done.
1.State the null and alternative hypotheses in words and in statistical symbols
2.What statistical test is appropriate to use? Explain the rationale for your answer
3.What is the value of the test statistic and the p-value of that outcome?
4.Interpret the outcome in terms of the original claim
5.What is unusual about this hypothesis test?
Homework Answers
Add Answer to:
The Dean of Instruction at a local college requested that a new
standardized test for an...
The Dean of Instruction at a local college requested that a new standardized test for an...
The Dean of Instruction at a local college requested that a new standardized test for an introductory statistics course be developed with the requirement that it should have µ = 120 points and σ = 15. A class of 30 students complete the new test with a mean grade of 115. Conduct a hypothesis test at α = .05 to determine whether the claim that µ = 120 can be supported. Use the p-value approach and complete the following to...
The dean of a college is interested in the proportion of graduates from his college who...
The dean of a college is interested in the proportion of graduates from his college who have a job offer on graduation day. He is particularly interested in seeing if there is a difference in this proportion for accounting and economics majors. In a random sample of 200 of each type of major at graduation, he found that 72 accounting majors and 52 economics majors had job offers. Assume pooled estimate of the population proportion and a level of significance...
Researchers are interested in examining the impact of three different Math instruction modules on standardized Math...
Researchers are interested in examining the impact of three different Math instruction modules on standardized Math achievement in 6th grade. Researchers sampled 13 6th grade students, and tested them each four times: after 1 month of standard instruction (control), after 1 month of module A, after 1 month of module B, and after 1 month of Module C. Researchers chose an alpha level of 0.05. SS total = 50; SS between subjects = 10; SS 1 = 10; SS 2...
The Dean of the College of Liberal Arts and Sciences (CLAS) reported that the mean time...
The Dean of the College of Liberal Arts and Sciences (CLAS) reported that the mean time for CLAS students to complete their degree at CU-Denver is less than 5 years. She randomly selected a sample of 25 recent CLAS graduates and found that their mean time to graduate was 4.75 years with a sample standard deviation of 0.8 years. At an α = 0.1 level, is their sufficient evidence to conclude that the mean time for CLAS students to complete...
Test: Exam#2 Out Submit Test isti This Question: 1 pt 9 of 19 (13 complete) This...
 Test: Exam#2 Out Submit Test isti This Question: 1 pt 9 of 19 (13 complete) This Test 19 pls p E Question Help Use technology to help you test the claim about the population mean, u, at the given level of normally distributed. Claim: μ > 11 70: α:0.07; σ 203 39. Sample statistics: x. 1194 38, n-250 Identify the null and alternative hypotheses. Choose the correct answer below O A. Ho:H> 1194.38 Ha Hs 119438 O B. Hous!19438 Ha...
3, Hypothesis testing for the mean (gis known) Find the P-value for a two-tailed hypothesis test with a standardized test statistic of z 1.64. Decide whether to reject Ho when the level of signif...
 3, Hypothesis testing for the mean (gis known) Find the P-value for a two-tailed hypothesis test with a standardized test statistic of z 1.64. Decide whether to reject Ho when the level of significance is α a. 0.10. b. Find the P-value for a right-tailed hypothesis test with a standardized test statistic of z 1.64. Decide whether to reject Ho when the level of significance is a0.10. Homeowners claim that the mean speed of automobiles traveling on their street is...
(a) Draw a curve and label each part to reflect a left, right, or two-tailed test...
(a) Draw a curve and label each part to reflect a left, right, or two-tailed test (b) Claim: Show in symbols H0, Ha (c) Critical value- find the z0 or t0 values (d) What are the standardized test statistic z or t, and the P values from the calculator? (e) Comparing the critical values, α value, against the calculator results, state whether you reject, or fail to reject the null hypothesis (f) Interpret the decision in the context of the...
Use a t-test to test the claim about the population mean μ at the given level...
 Use a t-test to test the claim about the population mean μ at the given level of significance α using the given sample statistics. Assume the population is normally distributed. Claim: μ# 25; α:0.05 Sample statistics: x 29.9, s-44, n 11 What is the value of the standardized test statistic? The standardized test statistic is(Round to two decimal places as needed.) What is the P-value of the test statistic? P-value (Round to three decimal places as needed.) Decide whether to...
Use technology to help you test the claim about the population mean, μ, at the given...
 Use technology to help you test the claim about the population mean, μ, at the given level of significance, α, using the given sample statistics. Assume the population is normally distributed. Claim: μ> 1 180: α 0.02; σ 211.79. Sample statistics: x 1203.69, n 250 ldentify the null and alternative hypotheses. Choose the correct answer below ) B. H0: μ s 1180 Ha : μ> 1180 Ha: μ 1203.69 HH 1180 Ha H 1180 O c. HOHs 1203 D. Ho...
(a) Draw a curve and label each part to reflect a left, right, or two-tailed test...
(a) Draw a curve and label each part to reflect a left, right, or two-tailed test (b) Claim: Show in symbols H0, Ha (c) Critical value- find the z0 or t0 values (d) What are the standardized test statistic z or t, and the P values from the calculator? (e) Comparing the critical values, α value, against the calculator results, state whether you reject, or fail to reject the null hypothesis (f) Interpret the decision in the context of the...
 Test: Exam#2 Out Submit Test isti This Question: 1 pt 9 of 19 (13 complete) This Test 19 pls p E Question Help Use technology to help you test the claim about the population mean, u, at the given level of normally distributed. Claim: μ > 11 70: α:0.07; σ 203 39. Sample statistics: x. 1194 38, n-250 Identify the null and alternative hypotheses. Choose the correct answer below O A. Ho:H> 1194.38 Ha Hs 119438 O B. Hous!19438 Ha...
 3, Hypothesis testing for the mean (gis known) Find the P-value for a two-tailed hypothesis test with a standardized test statistic of z 1.64. Decide whether to reject Ho when the level of significance is α a. 0.10. b. Find the P-value for a right-tailed hypothesis test with a standardized test statistic of z 1.64. Decide whether to reject Ho when the level of significance is a0.10. Homeowners claim that the mean speed of automobiles traveling on their street is...
 Use a t-test to test the claim about the population mean μ at the given level of significance α using the given sample statistics. Assume the population is normally distributed. Claim: μ# 25; α:0.05 Sample statistics: x 29.9, s-44, n 11 What is the value of the standardized test statistic? The standardized test statistic is(Round to two decimal places as needed.) What is the P-value of the test statistic? P-value (Round to three decimal places as needed.) Decide whether to...
 Use technology to help you test the claim about the population mean, μ, at the given level of significance, α, using the given sample statistics. Assume the population is normally distributed. Claim: μ> 1 180: α 0.02; σ 211.79. Sample statistics: x 1203.69, n 250 ldentify the null and alternative hypotheses. Choose the correct answer below ) B. H0: μ s 1180 Ha : μ> 1180 Ha: μ 1203.69 HH 1180 Ha H 1180 O c. HOHs 1203 D. Ho...
Most questions answered within 3 hours.
-
A
752 mL sample of water was placed in a 1000 gram pan of aluminum.
The...
asked 23 seconds ago -
1 point) Given the significance level α=0.01 find the following:
(a) left-tailed z value z= (b)...
asked 1 minute ago -
Calculate the expected value, the variance, and the standard
deviation of the given random variable X....
asked 3 minutes ago -
Assume that in a hydrogen atom, the electron circles the nucleus
in a circle of radius...
asked 7 minutes ago -
Describe two obstacles that makes fixing atmospheric nitrogen
difficult.
asked 12 minutes ago -
T
F 53) Most differences
between human groups are the result of biology rather than
culture....
asked 17 minutes ago -
A 5.20 mW helium neon laser emits a visible laser beam with a
wavelength of 633...
asked 20 minutes ago -
Assignment:
Your
organization has made a strategic decision
to
outsourcework
currently performed in house. You have...
asked 18 minutes ago -
A hospital performs 100 surgeries per week. The probability that
complications after surgery occur is 10%....
asked 19 minutes ago -
In preparing its cash flow statement for the year ended December
31, 2018, Green Co. gathered...
asked 21 minutes ago -
Donna is 18 years old and full time accounting student.She is
saving for an overseas holiday...
asked 21 minutes ago -
Service-oriented architectures (SOA) provide
object-oriented architectures for web platforms that represent a
collection of services. SOA...
asked 22 minutes ago