P.S. Please do not post that "hand-written" response that contains many errors. Thanks for answering this for me!
Homework Answers
Solution
Part (1)
Repeated-Measures ANOVA Answer 1
Explanation
If it were a factorial experiment, there must have been at least two treatments. Further, F is calculated only for ‘Treatment’ so ‘subjects’ is treated as repeat measurement.
Part (2)
Yes Answer 2
Explanation
Given p-value (p) is less than the given significance level of 0.05
Part (3)
Yes. Answer 3
Explanation
Under the null hypothesis of no treatment effect, F ~ F4,76 and so given α = 0.01, the critical value is the upper 1% point of F4,76 which is 3.57 [using Excel Function: Statistical FINV]
Since F value > critical value, null hypothesis stands rejected implying that the results are significant.
Note:
Depending solely on the given information only, no definite conclusion can be made, because p < 0.05 does not necessarily imply it is less than 0.01 – it could as well be lying between 0.01 and 0.05. However using Excel Function: Statistical FDIST,
p-value [i.e., P(F4,76 > 6)] can be found to be 0.0003. This being less than 0.01, null hypothesis stands rejected]
Part (4)
Here, ‘subjects’ would become treatment. This would lead to:
MS = 323/19 = 17; F = 17/3 = 5.67; p-value = P(F19,76 > 5.67) < 0.01;
Hence, the null hypothesis stands rejected at α = 0.01 and 0.05 implying the results are significant. Answer 4
DONE
Add Answer to:
P.S. Please do not post that "hand-written" response that
contains many errors. Thanks for answering this...
p Use the source table shown below to answer questions 1 to 4. Source SS df...
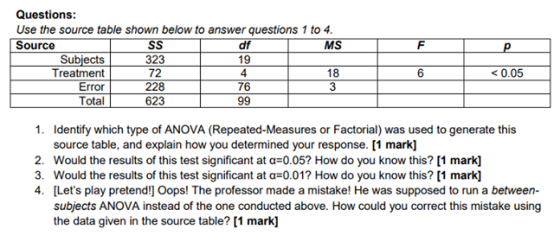
 p Use the source table shown below to answer questions 1 to 4. Source SS df MS Subjects 323 19 Treatment 72 4 18 Error 228 76 3 Total 623 99 6 < 0.05 1. Identify which type of ANOVA (Repeated-Measures or Factorial) was used to generate this source table, and explain how you determined your response. [1 mark] 2. Would the results of this test significant at a=0.05? How do you know this? [1 mark] 3. Would the results...
p Use the source table shown below to answer questions 1 to 4. Source SS df...
 p Use the source table shown below to answer questions 1 to 4. Source SS df MS Subjects 323 19 Treatment 72 4 18 Error 228 76 3 Total 623 99 6 < 0.05 1. Identify which type of ANOVA (Repeated-Measures or Factorial) was used to generate this source table, and explain how you determined your response. [1 mark] 2. Would the results of this test significant at a=0.05? How do you know this? [1 mark] 3. Would the results...
P.S. Please do not post that "hand-written" response that contains many errors. Thanks for answering this...
 P.S. Please do not post that "hand-written" response that
contains many errors. Thanks for answering this for me!
Use the source table shown below to answer questions 5 to 7. Source SS df MS Colour (C) 28 2 14 Type (U) 8 2 CxT 40 4 10 Error 162 81 2 Total 238 89 F 7 2 5 p < 0.01 > 0.05 < 0.01 4 5. Assuming this is an independent design, how many groups of subjects would be...
P.S. Please do not post that "hand-written" response that
contains many errors. Thanks for answering this for me!
Use the source table shown below to answer questions 5 to 7. Source SS df MS Colour (C) 28 2 14 Type (U) 8 2 CxT 40 4 10 Error 162 81 2 Total 238 89 F 7 2 5 p < 0.01 > 0.05 < 0.01 4 5. Assuming this is an independent design, how many groups of subjects would be...
F p Questions: Use the source table shown below to answer questions 1 to 4. Source...
 F p Questions: Use the source table shown below to answer questions 1 to 4. Source SS df MS Subjects 323 19 Treatment 72 4 18 Error 76 3 Total 623 99 6 < 0.05 228 1. Identify which type of ANOVA (Repeated-Measures or Factorial) was used to generate this source table, and explain how you determined your response. [1 mark] 2. Would the results of this test significant at a=0.05? How do you know this? [1 mark] 3. Would...
MS F 7 2 5 р < 0.01 > 0.05 < 0.01 Use the source table...
 MS F 7 2 5 р < 0.01 > 0.05 < 0.01 Use the source table shown below to answer questions 5 to 7. Source SS df Colour (C) 28 2 14 Type (T) 8 2 4 CxT 40 4 10 Error 162 81 2 Total 238 89 5. Assuming this is an independent design, how many groups of subjects would be used in this study, and how many subjects would be in each group? Explain your response and show...
Use the source table shown below to answer questions 5 to 7. Source SS df MS...
 Use the source table shown below to answer questions 5 to 7. Source SS df MS Colour (C) 28 2 14 Type (T) 8 2 4 CXT 40 4 10 Error 162 81 2 Total 238 89 F 7 2 5 р < 0.01 > 0.05 < 0.01 5. Assuming this is an independent design, how many groups of subjects would be used in this study, and how many subjects would be in each group? Explain your response (and show...
How do you write up an interpretation of the results ? I already filled out the...
 How do you write up an interpretation of the results ?
I already filled out the table, however I need help with a
written format of he results of this study.
Please see picture for what has to be included in the write
up.
Problem 6-Write-up . Your written report of the ANOVA results should include the following in a paragraph of text (i.e., NOT a bulleted list): . The name of the statistical test used The variables in the...
How do you write up an interpretation of the results ?
I already filled out the table, however I need help with a
written format of he results of this study.
Please see picture for what has to be included in the write
up.
Problem 6-Write-up . Your written report of the ANOVA results should include the following in a paragraph of text (i.e., NOT a bulleted list): . The name of the statistical test used The variables in the...
could you please run a two way anova test on SPSS? not on excel? and post...
 could you please run a two way anova test on SPSS? not on excel?
and post the test of between subject effect table and could you
also label the dependent and indepedent variable and do a post hoc
test for the significant effects?
View Share Window Help Computer Assignment 3 - Edited Qo Collaborate Insert Table Chart Text Shape Media Comment Part 2 - two-way independent ANOVA A research study was conducted to examine the impact of eating a high...
could you please run a two way anova test on SPSS? not on excel?
and post the test of between subject effect table and could you
also label the dependent and indepedent variable and do a post hoc
test for the significant effects?
View Share Window Help Computer Assignment 3 - Edited Qo Collaborate Insert Table Chart Text Shape Media Comment Part 2 - two-way independent ANOVA A research study was conducted to examine the impact of eating a high...
Problem 1 Do this problem by hand - you may use Excel for calculations The tensile...
 Problem 1 Do this problem by hand - you may use Excel for calculations The tensile strength of Portland cement is being studied. Several different mixing techniques can be used economically. A completely randomized experiment is conducted to determine if mixing technique has a significant effect on the mean tensile strength of cement. Several measurements of tensile strength are recorded (see table below) for each mixing technique Tensile Strength (lb/in2) measurements 1 324 448 364 654 4 504 485 422...
 p Use the source table shown below to answer questions 1 to 4. Source SS df MS Subjects 323 19 Treatment 72 4 18 Error 228 76 3 Total 623 99 6 < 0.05 1. Identify which type of ANOVA (Repeated-Measures or Factorial) was used to generate this source table, and explain how you determined your response. [1 mark] 2. Would the results of this test significant at a=0.05? How do you know this? [1 mark] 3. Would the results...
 p Use the source table shown below to answer questions 1 to 4. Source SS df MS Subjects 323 19 Treatment 72 4 18 Error 228 76 3 Total 623 99 6 < 0.05 1. Identify which type of ANOVA (Repeated-Measures or Factorial) was used to generate this source table, and explain how you determined your response. [1 mark] 2. Would the results of this test significant at a=0.05? How do you know this? [1 mark] 3. Would the results...
 p Use the source table shown below to answer questions 1 to 4. Source SS df MS Subjects 323 19 Treatment 72 4 18 Error 228 76 3 Total 623 99 6 < 0.05 1. Identify which type of ANOVA (Repeated-Measures or Factorial) was used to generate this source table, and explain how you determined your response. [1 mark] 2. Would the results of this test significant at a=0.05? How do you know this? [1 mark] 3. Would the results...
 P.S. Please do not post that "hand-written" response that
contains many errors. Thanks for answering this for me!
Use the source table shown below to answer questions 5 to 7. Source SS df MS Colour (C) 28 2 14 Type (U) 8 2 CxT 40 4 10 Error 162 81 2 Total 238 89 F 7 2 5 p < 0.01 > 0.05 < 0.01 4 5. Assuming this is an independent design, how many groups of subjects would be...
P.S. Please do not post that "hand-written" response that
contains many errors. Thanks for answering this for me!
Use the source table shown below to answer questions 5 to 7. Source SS df MS Colour (C) 28 2 14 Type (U) 8 2 CxT 40 4 10 Error 162 81 2 Total 238 89 F 7 2 5 p < 0.01 > 0.05 < 0.01 4 5. Assuming this is an independent design, how many groups of subjects would be...
 F p Questions: Use the source table shown below to answer questions 1 to 4. Source SS df MS Subjects 323 19 Treatment 72 4 18 Error 76 3 Total 623 99 6 < 0.05 228 1. Identify which type of ANOVA (Repeated-Measures or Factorial) was used to generate this source table, and explain how you determined your response. [1 mark] 2. Would the results of this test significant at a=0.05? How do you know this? [1 mark] 3. Would...
 MS F 7 2 5 р < 0.01 > 0.05 < 0.01 Use the source table shown below to answer questions 5 to 7. Source SS df Colour (C) 28 2 14 Type (T) 8 2 4 CxT 40 4 10 Error 162 81 2 Total 238 89 5. Assuming this is an independent design, how many groups of subjects would be used in this study, and how many subjects would be in each group? Explain your response and show...
 Use the source table shown below to answer questions 5 to 7. Source SS df MS Colour (C) 28 2 14 Type (T) 8 2 4 CXT 40 4 10 Error 162 81 2 Total 238 89 F 7 2 5 р < 0.01 > 0.05 < 0.01 5. Assuming this is an independent design, how many groups of subjects would be used in this study, and how many subjects would be in each group? Explain your response (and show...
 How do you write up an interpretation of the results ?
I already filled out the table, however I need help with a
written format of he results of this study.
Please see picture for what has to be included in the write
up.
Problem 6-Write-up . Your written report of the ANOVA results should include the following in a paragraph of text (i.e., NOT a bulleted list): . The name of the statistical test used The variables in the...
How do you write up an interpretation of the results ?
I already filled out the table, however I need help with a
written format of he results of this study.
Please see picture for what has to be included in the write
up.
Problem 6-Write-up . Your written report of the ANOVA results should include the following in a paragraph of text (i.e., NOT a bulleted list): . The name of the statistical test used The variables in the...
 could you please run a two way anova test on SPSS? not on excel?
and post the test of between subject effect table and could you
also label the dependent and indepedent variable and do a post hoc
test for the significant effects?
View Share Window Help Computer Assignment 3 - Edited Qo Collaborate Insert Table Chart Text Shape Media Comment Part 2 - two-way independent ANOVA A research study was conducted to examine the impact of eating a high...
could you please run a two way anova test on SPSS? not on excel?
and post the test of between subject effect table and could you
also label the dependent and indepedent variable and do a post hoc
test for the significant effects?
View Share Window Help Computer Assignment 3 - Edited Qo Collaborate Insert Table Chart Text Shape Media Comment Part 2 - two-way independent ANOVA A research study was conducted to examine the impact of eating a high...
 Problem 1 Do this problem by hand - you may use Excel for calculations The tensile strength of Portland cement is being studied. Several different mixing techniques can be used economically. A completely randomized experiment is conducted to determine if mixing technique has a significant effect on the mean tensile strength of cement. Several measurements of tensile strength are recorded (see table below) for each mixing technique Tensile Strength (lb/in2) measurements 1 324 448 364 654 4 504 485 422...
Most questions answered within 3 hours.
-
1) Who is a Hispanic consumer?
2) Who is a Latin consumer?
3) Are Hispanic and...
asked 7 minutes ago -
Rod figures that it takes an average (mean) of =20 minutes with
a standard deviation of...
asked 26 minutes ago -
You have 5 ul of a pure (undiluted) culture at a concentration
of 3.6 x 10⁶...
asked 30 minutes ago -
______ activity indicates the presence of an electron transport
chain.
1- gelatinase 2- oxidase 3- caseinase...
asked 33 minutes ago -
The molarity of a silver nitrate solution is 0.192 M. How many
grams of silver ions...
asked 46 minutes ago -
Which of the following solutes will produce a greater increase
in boiling point when it is...
asked 42 minutes ago -
true or false: Series connected electrical circuit is a voltage
divider, and voltage of each device...
asked 37 minutes ago -
A 100-W lightbulb has a resistance of about 12 Ω when cold (20
∘C) and 128...
asked 41 minutes ago -
For the asset shown in the following table, use the capital
asset pricing model to find...
asked 42 minutes ago -
If the impulse response of a circuit is a pulse y(t) = u(t) –
u(t-T), T...
asked 48 minutes ago -
Eukaryotic cells have __ which is similar to prokaryotes of
Archaea.
A Ester-linked membrane lipids
B...
asked 57 minutes ago -
true or false. If work is done on a system by it's
surroundings, its value is...
asked 1 hour ago