Consider Chapter? 3, Problem 4 that was a homework problem dealing with the quality of Aspen Plastics bottle neck diameters. For randomly entered? data, results were obtained as shown? below:
For the data? shown, the calculation of the Lower Control Limit for the? X-bar chart is equal to which of the? following?
A. none of these
B. =D9-D10*D16
C. =D9+D10*D16
D. = 0.729
PLEASE INDICATE CORRECT ANSWER ONLY!
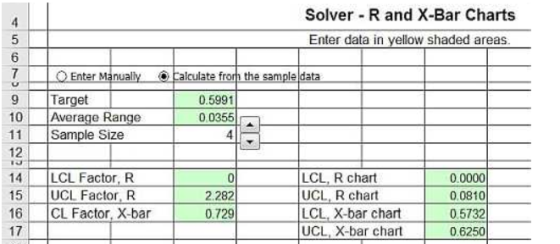
Homework Answers
Lower Control Limit for X bar chart
= Xbar – A2 x Rbar
Where,
Xbar = Average value of sample means
A2 = Value of constant as derived from standard table for Xbar and Range chart
Rbar = Average range
In the given case ,
D16 stands for value of A2 ( i.e. control Limit factor for Xbar )
D10 stands for Rbar average range
We would have accepted CLCL of Xbar chart as :
D9 – D10 X D16
Provided D9 stood for Xbar
However it is mentioned that D9 is the “target value” and not “Xbar”
Therefore , answer would be “A.None of the Above “
Add Answer to:
Consider Chapter? 3, Problem 4 that was a homework problem
dealing with the quality of Aspen...
4 Aspen Plastics produces plastic bottles to customer order. The quality inspector randomly selects four bottles...
 4 Aspen Plastics produces plastic bottles to customer order. The quality inspector randomly selects four bottles from the bottle machine and measures the outside diameter of the bottle neck, a critical quality dimension that determines whether the bottle cap will fit properly. The dimensions (in.) from the last six samples are Bottle Sample 1 2 3 0.592 0.588 0.590 0.617 2 0.598 0.587 0.580 0.585 3 0.613 0.594 0.615 0.589 0.608 0.610 0.623 0.623 5 0.572 0.623 0.572 0.585 0.582...
Aspen Plastics produces plastic bottles to customer order. The quality inspector randomly selects four bottles from...
Aspen Plastics produces plastic bottles to customer order. The quality inspector randomly selects four bottles from the bottle machine and measures the outside diameter of the bottle? neck, a critical quality dimension that determines whether the bottle cap will fit properly. The dimensions? (in.) from the last six samples are Bottle Sample 1 2 3 4 1 0.5910.591 0.6170.617 0.6020.602 0.5900.590 2 0.5830.583 0.5860.586 0.5800.580 0.5900.590 3 0.5760.576 0.5750.575 0.5860.586 0.6190.619 4 0.6220.622 0.6190.619 0.6180.618 0.5720.572 5 0.6050.605 0.5840.584 0.6200.620...
A) Set the control limits for the process for the x(bar) chart when the maching is working proper...
 round to 3 decimal places ?
A) Set the control limits for the process for the x(bar) chart when the maching is working properly UCL-x-? grams (round to two decimal places) LCL-x grams (round to two decimal places) B) Set the control limits for this process for the R-chart. UCLrgrams (round to two decimal places) LCLr grams (round to two decimal places) Refer to the table Factors for Computing Control Chart Limits (3 sigma) for this problem. Your supervisor, Lisa...
round to 3 decimal places ?
A) Set the control limits for the process for the x(bar) chart when the maching is working properly UCL-x-? grams (round to two decimal places) LCL-x grams (round to two decimal places) B) Set the control limits for this process for the R-chart. UCLrgrams (round to two decimal places) LCLr grams (round to two decimal places) Refer to the table Factors for Computing Control Chart Limits (3 sigma) for this problem. Your supervisor, Lisa...
You are monitoring length of corn that your sister is selling at the farmer’s market. You...
You are monitoring length of corn that your sister is selling at the farmer’s market. You have following data over 4 days. Draw 3 sigma level control charts (X-bar and R-chart). Calculate and show values for UCL, CL, and LCL using the table given below. Discuss your graphs. Is everything okay? day 1 day 2 day 3 day 4 15 13 10 8 13 12 9 7 15 11 11 9 Factors for 3 Sigma level Sample Control Limit...
that was the complete data the second picture is the control limits Refer to Table S61...
 that was the complete data the second picture is the control
limits
Refer to Table S61 - Factors for Computing Control Chart Limits (3 sigma) for this problem. Ross Hopkins is attempting to monitor a filling process that has an overall average of 705 mL. The average range R is 8 ml. For a sample size of 10, the control limits for 3-sigma x chart are: Upper Control Limit (UCL.2)= ml (round your response to three decimal places). Lower Control...
that was the complete data the second picture is the control
limits
Refer to Table S61 - Factors for Computing Control Chart Limits (3 sigma) for this problem. Ross Hopkins is attempting to monitor a filling process that has an overall average of 705 mL. The average range R is 8 ml. For a sample size of 10, the control limits for 3-sigma x chart are: Upper Control Limit (UCL.2)= ml (round your response to three decimal places). Lower Control...
Problem 6s.11ac Question Help Refer to Table $6.1 - Factors for Computing Control Chart Limits (3...
 Problem 6s.11ac Question Help Refer to Table $6.1 - Factors for Computing Control Chart Limits (3 sigma) for this problem. Twelve samples, each containing five parts, were taken from a process that produces steel rods at Emmanual Kodzi's factory. The length of each rod in the samples was determined. The results were tabulated and sample means and ranges were computed. The results were: Sample Sample Mean Range qe (in.) (in.) 9.402 0.033 9.404 0.041 9.391 0.034 9.408 0.051 9.399 0.031...
QC.58 Dairy Man Industries produces a variety of dairy products such as cheese, sour cream and...
QC.58 Dairy Man Industries produces a variety of dairy products such as cheese, sour cream and yogurt. One of their more popular products is a 3-pound block of sliced American cheese. They have a high-speed manufacturing line that automatically slices, stacks, and packages this product. Each hour their automated equipment will sample 20 blocks of cheese to make sure they are close in weight to the target value of 48.1 ounces and within control limits. The table below contain the...
 4 Aspen Plastics produces plastic bottles to customer order. The quality inspector randomly selects four bottles from the bottle machine and measures the outside diameter of the bottle neck, a critical quality dimension that determines whether the bottle cap will fit properly. The dimensions (in.) from the last six samples are Bottle Sample 1 2 3 0.592 0.588 0.590 0.617 2 0.598 0.587 0.580 0.585 3 0.613 0.594 0.615 0.589 0.608 0.610 0.623 0.623 5 0.572 0.623 0.572 0.585 0.582...
 round to 3 decimal places ?
A) Set the control limits for the process for the x(bar) chart when the maching is working properly UCL-x-? grams (round to two decimal places) LCL-x grams (round to two decimal places) B) Set the control limits for this process for the R-chart. UCLrgrams (round to two decimal places) LCLr grams (round to two decimal places) Refer to the table Factors for Computing Control Chart Limits (3 sigma) for this problem. Your supervisor, Lisa...
round to 3 decimal places ?
A) Set the control limits for the process for the x(bar) chart when the maching is working properly UCL-x-? grams (round to two decimal places) LCL-x grams (round to two decimal places) B) Set the control limits for this process for the R-chart. UCLrgrams (round to two decimal places) LCLr grams (round to two decimal places) Refer to the table Factors for Computing Control Chart Limits (3 sigma) for this problem. Your supervisor, Lisa...
 that was the complete data the second picture is the control
limits
Refer to Table S61 - Factors for Computing Control Chart Limits (3 sigma) for this problem. Ross Hopkins is attempting to monitor a filling process that has an overall average of 705 mL. The average range R is 8 ml. For a sample size of 10, the control limits for 3-sigma x chart are: Upper Control Limit (UCL.2)= ml (round your response to three decimal places). Lower Control...
that was the complete data the second picture is the control
limits
Refer to Table S61 - Factors for Computing Control Chart Limits (3 sigma) for this problem. Ross Hopkins is attempting to monitor a filling process that has an overall average of 705 mL. The average range R is 8 ml. For a sample size of 10, the control limits for 3-sigma x chart are: Upper Control Limit (UCL.2)= ml (round your response to three decimal places). Lower Control...
 Problem 6s.11ac Question Help Refer to Table $6.1 - Factors for Computing Control Chart Limits (3 sigma) for this problem. Twelve samples, each containing five parts, were taken from a process that produces steel rods at Emmanual Kodzi's factory. The length of each rod in the samples was determined. The results were tabulated and sample means and ranges were computed. The results were: Sample Sample Mean Range qe (in.) (in.) 9.402 0.033 9.404 0.041 9.391 0.034 9.408 0.051 9.399 0.031...
Most questions answered within 3 hours.
-
Fiscal policy is the deliberate manipulation of taxes and
government spending to alter GDP, employment, inflation...
asked 28 minutes ago -
evaluating an expression using only one digit and + and - as
operators ....3+5-1+7-5+8
-----------------------
stack...
asked 29 minutes ago -
Two concentric current loops lie in the same plane. The smaller
loop has a radius of...
asked 57 minutes ago -
1)Which of the following is an
important difference between qualified and nonqualified retirement
plans?
a. Qualified...
asked 1 hour ago -
What's the streaming business's problem on the
horizon?
asked 2 hours ago -
I need help with writing the conclusion for this online lab
report
Abstract
By testing the...
asked 2 hours ago -
For the reaction 1N2+3H2-----> 2NH3, would the reaction rate
trend be: delta[NH3]/ delta t = -2...
asked 2 hours ago -
Within your current/past organization, identify a problem/issue
and format a design to address same. You may...
asked 2 hours ago -
A sock stuck to the side of a clothes-dryer barrel has a
centripetal acceleration of 24...
asked 3 hours ago -
A perfect gas undergoes an isentropic process such that its
volume doubles. If the ratio of...
asked 4 hours ago -
list the elements in groups 3A to 6A in the same order as in the
periodic...
asked 4 hours ago -
Estimating effect size. Peng and Chen (2014)
evaluated effect size estimates for various tests. In their...
asked 4 hours ago