
Homework Answers
Add Answer to:
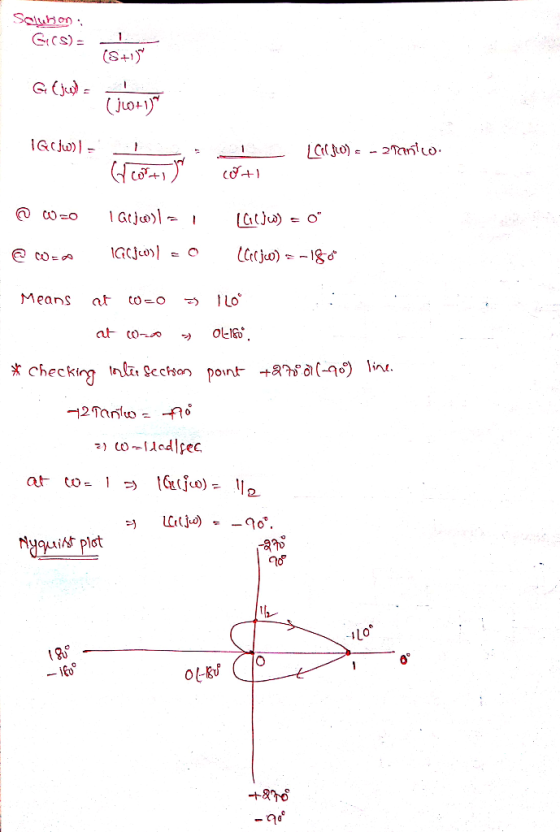
Draw the Nyquist plot using the bode plot below.
G(s)=1/(s+1)^2
1. Draw the Nyquist plot using...
please show steps 5. GH(s) is a minimum-phase system which has the Bode plot shown below. It is desired to increase the phase margin by 40 degrees and also increase the closed-loop system bandwidth....
 please show steps
5. GH(s) is a minimum-phase system which has the Bode plot shown below. It is desired to increase the phase margin by 40 degrees and also increase the closed-loop system bandwidth. Design a lead compensator for this purpose. Determine (1) the ratio of the pole to the zero, α , (2) the frequency where the maximum phase shift from the compensator should be placed, and then (3) the pole and zero. You need not draw the Bode...
please show steps
5. GH(s) is a minimum-phase system which has the Bode plot shown below. It is desired to increase the phase margin by 40 degrees and also increase the closed-loop system bandwidth. Design a lead compensator for this purpose. Determine (1) the ratio of the pole to the zero, α , (2) the frequency where the maximum phase shift from the compensator should be placed, and then (3) the pole and zero. You need not draw the Bode...
Consider the system given below where K is a constant gain, Gp is the plant, and Ge is a compensator. The Bode Plots of a Gp is given below. Problem 1: Bode Diagram 20 2 40 -60 80 -100 90 135 180 a 2...
 Consider the system given below where K is a constant gain, Gp is the plant, and Ge is a compensator. The Bode Plots of a Gp is given below. Problem 1: Bode Diagram 20 2 40 -60 80 -100 90 135 180 a 225 270 101 10 Frequency (rad/s) 102 a. Looking at the low frequency behavior, determine its number of poles at origin. Explain. b. Looking at the high frequency behavior, determine the number of excess poles. Explain. C....
consider a negative unity feedback system whose feedforward transfer function is: (s) + 1/[(s+0.11(s+1)(s+10)] Braw a...
 consider a negative unity feedback system whose feedforward transfer function is: (s) + 1/[(s+0.11(s+1)(s+10)] Braw a Bode plot of the open loop transfer function that includes an asymptotic and approximate estimate for both magnitude and phase. Answer he following questions D Question 1 5 pts Low frequency DC gain is_db 00 0 1 10 100 none of these Question 2 Low frequency DC phase lag is _ degrees 0 -90 -180 -270 -360 none of these Question 3 Asymptotic magnitude...
Consider the following magnitude and phase plot of a minimum phase system. Please answer the following and explain. Consider the following magnitude and phase plot of a minimum phase system. Is this...
 Consider the following magnitude and phase plot of a minimum
phase system. Please answer the following and explain.
Consider the following magnitude and phase plot of a minimum phase system. Is this system stable or unstable? Explain your answer. Bode Diagram: Minimum-Phase Systenm 100 Gain Crossover 40 -60 80 100 90 135 -180 225 -270 -360 Phase Crossover Op Og Frequency (rad/sec)
Consider the following magnitude and phase plot of a minimum phase system. Is this system stable or unstable?...
Consider the following magnitude and phase plot of a minimum
phase system. Please answer the following and explain.
Consider the following magnitude and phase plot of a minimum phase system. Is this system stable or unstable? Explain your answer. Bode Diagram: Minimum-Phase Systenm 100 Gain Crossover 40 -60 80 100 90 135 -180 225 -270 -360 Phase Crossover Op Og Frequency (rad/sec)
Consider the following magnitude and phase plot of a minimum phase system. Is this system stable or unstable?...
7.5 (2 points) Given the Bode plot shown below: Bode Diagram 50 -50 E -100 150 O 45 a -90 135 180...
 7.5 (2 points) Given the Bode plot shown below: Bode Diagram 50 -50 E -100 150 O 45 a -90 135 180 10 102 Frequency (radis) 103 10 10 10 Find the associated transfer function Gs).Enter your answer symbolically in terms of s. For proper grading, do not factor out terms in the numerator or denominator, e.g., enter 5-+1015 and not5- (+2+3. G(s)-
7.5 (2 points) Given the Bode plot shown below: Bode Diagram 50 -50 E -100 150 O...
7.5 (2 points) Given the Bode plot shown below: Bode Diagram 50 -50 E -100 150 O 45 a -90 135 180 10 102 Frequency (radis) 103 10 10 10 Find the associated transfer function Gs).Enter your answer symbolically in terms of s. For proper grading, do not factor out terms in the numerator or denominator, e.g., enter 5-+1015 and not5- (+2+3. G(s)-
7.5 (2 points) Given the Bode plot shown below: Bode Diagram 50 -50 E -100 150 O...
A bode plot of the transfer function, GS = - 25 $2+45+25, is shown as below....
 A bode plot of the transfer function, GS = - 25 $2+45+25, is shown as below. Bode Diagram System sys Frequency (rad/s): 7 Magnitude (dB): -3.4 Magnitude (dB) Phase (deg) Systemt sys Frequency (rad/s): 7 Phase (deg): - 130 - 135 - 180 10 Frequency (rad/s) Determine the frequency response y(t) when a sinusoidal function, X(t) = 10 sin (7t +30) is applied to the transfer function as an input signal. (20 points)
5. Consider the feedback system in Figure 4 where! G(s) = 26+10% Figure 4 The Bode...
 5. Consider the feedback system in Figure 4 where! G(s) = 26+10% Figure 4 The Bode plot of G is shown in Figure 5. Boda Diagram Magnitude (dB) -100- -156 -135 -root -225 10 Frequency radici Figure 5: Bode plot of G (a) [2 marks] Find the phase margin, gain margin and gain crossover frequency (approximate as needed) for the case when C(s) = 1. PM = GM = wc = You are asked to design a feedback controller C(s)...
Problem 3 (20 points) A Bode plot is a graph of the frequency response of a system. It is a combi...
 Problem 3 (20 points) A Bode plot is a graph of the frequency response of a system. It is a combination of a magnitude plot, expressing the magnitude in dB of the frequency response, and a phase plot expressing the phase shift. Both quantities are plotted on a horizontal axis proportional to the logarithm of the frequency. Below is an example of a Bode plot created in Matlab. Bode Diagram 0 -20 3-40 E-60 -80 180 90 10 10 10...
Problem #4) Sketch the square wave response of a circuit, given its bode plot shown here....
 Problem #4) Sketch the square wave response of a circuit, given its bode plot shown here. Bode Diagram 20 60 pautr 45 135 180 101 101 Frequency (rad/s) Bonus (2 points): Draw a circuit that will match both of the behaviors shown above.
consider a negative unity feedback system whose feedforward transfer function is: (s) - 1/((s+0.11(s+1)(s+10) Brawa Bode...
 consider a negative unity feedback system whose feedforward transfer function is: (s) - 1/((s+0.11(s+1)(s+10) Brawa Bode plot of the open loop transfer function that includes an asymptotic and approximate estimate for both magnitude and phase. Answer he following questions Asymptotic phase lag at 1 rad/sec is _ degrees 0 -45 -90 0-135 -180 225 270 325 -360 Asymptotic phase lag at 10 rad/sec is _ degrees 0 -45 -90 0 -135 -180 -225 -270 360 none of these Asymptotic phase...
 please show steps
5. GH(s) is a minimum-phase system which has the Bode plot shown below. It is desired to increase the phase margin by 40 degrees and also increase the closed-loop system bandwidth. Design a lead compensator for this purpose. Determine (1) the ratio of the pole to the zero, α , (2) the frequency where the maximum phase shift from the compensator should be placed, and then (3) the pole and zero. You need not draw the Bode...
please show steps
5. GH(s) is a minimum-phase system which has the Bode plot shown below. It is desired to increase the phase margin by 40 degrees and also increase the closed-loop system bandwidth. Design a lead compensator for this purpose. Determine (1) the ratio of the pole to the zero, α , (2) the frequency where the maximum phase shift from the compensator should be placed, and then (3) the pole and zero. You need not draw the Bode...
 Consider the system given below where K is a constant gain, Gp is the plant, and Ge is a compensator. The Bode Plots of a Gp is given below. Problem 1: Bode Diagram 20 2 40 -60 80 -100 90 135 180 a 225 270 101 10 Frequency (rad/s) 102 a. Looking at the low frequency behavior, determine its number of poles at origin. Explain. b. Looking at the high frequency behavior, determine the number of excess poles. Explain. C....
 consider a negative unity feedback system whose feedforward transfer function is: (s) + 1/[(s+0.11(s+1)(s+10)] Braw a Bode plot of the open loop transfer function that includes an asymptotic and approximate estimate for both magnitude and phase. Answer he following questions D Question 1 5 pts Low frequency DC gain is_db 00 0 1 10 100 none of these Question 2 Low frequency DC phase lag is _ degrees 0 -90 -180 -270 -360 none of these Question 3 Asymptotic magnitude...
 Consider the following magnitude and phase plot of a minimum
phase system. Please answer the following and explain.
Consider the following magnitude and phase plot of a minimum phase system. Is this system stable or unstable? Explain your answer. Bode Diagram: Minimum-Phase Systenm 100 Gain Crossover 40 -60 80 100 90 135 -180 225 -270 -360 Phase Crossover Op Og Frequency (rad/sec)
Consider the following magnitude and phase plot of a minimum phase system. Is this system stable or unstable?...
Consider the following magnitude and phase plot of a minimum
phase system. Please answer the following and explain.
Consider the following magnitude and phase plot of a minimum phase system. Is this system stable or unstable? Explain your answer. Bode Diagram: Minimum-Phase Systenm 100 Gain Crossover 40 -60 80 100 90 135 -180 225 -270 -360 Phase Crossover Op Og Frequency (rad/sec)
Consider the following magnitude and phase plot of a minimum phase system. Is this system stable or unstable?...
 7.5 (2 points) Given the Bode plot shown below: Bode Diagram 50 -50 E -100 150 O 45 a -90 135 180 10 102 Frequency (radis) 103 10 10 10 Find the associated transfer function Gs).Enter your answer symbolically in terms of s. For proper grading, do not factor out terms in the numerator or denominator, e.g., enter 5-+1015 and not5- (+2+3. G(s)-
7.5 (2 points) Given the Bode plot shown below: Bode Diagram 50 -50 E -100 150 O...
7.5 (2 points) Given the Bode plot shown below: Bode Diagram 50 -50 E -100 150 O 45 a -90 135 180 10 102 Frequency (radis) 103 10 10 10 Find the associated transfer function Gs).Enter your answer symbolically in terms of s. For proper grading, do not factor out terms in the numerator or denominator, e.g., enter 5-+1015 and not5- (+2+3. G(s)-
7.5 (2 points) Given the Bode plot shown below: Bode Diagram 50 -50 E -100 150 O...
 A bode plot of the transfer function, GS = - 25 $2+45+25, is shown as below. Bode Diagram System sys Frequency (rad/s): 7 Magnitude (dB): -3.4 Magnitude (dB) Phase (deg) Systemt sys Frequency (rad/s): 7 Phase (deg): - 130 - 135 - 180 10 Frequency (rad/s) Determine the frequency response y(t) when a sinusoidal function, X(t) = 10 sin (7t +30) is applied to the transfer function as an input signal. (20 points)
 5. Consider the feedback system in Figure 4 where! G(s) = 26+10% Figure 4 The Bode plot of G is shown in Figure 5. Boda Diagram Magnitude (dB) -100- -156 -135 -root -225 10 Frequency radici Figure 5: Bode plot of G (a) [2 marks] Find the phase margin, gain margin and gain crossover frequency (approximate as needed) for the case when C(s) = 1. PM = GM = wc = You are asked to design a feedback controller C(s)...
 Problem 3 (20 points) A Bode plot is a graph of the frequency response of a system. It is a combination of a magnitude plot, expressing the magnitude in dB of the frequency response, and a phase plot expressing the phase shift. Both quantities are plotted on a horizontal axis proportional to the logarithm of the frequency. Below is an example of a Bode plot created in Matlab. Bode Diagram 0 -20 3-40 E-60 -80 180 90 10 10 10...
 Problem #4) Sketch the square wave response of a circuit, given its bode plot shown here. Bode Diagram 20 60 pautr 45 135 180 101 101 Frequency (rad/s) Bonus (2 points): Draw a circuit that will match both of the behaviors shown above.
 consider a negative unity feedback system whose feedforward transfer function is: (s) - 1/((s+0.11(s+1)(s+10) Brawa Bode plot of the open loop transfer function that includes an asymptotic and approximate estimate for both magnitude and phase. Answer he following questions Asymptotic phase lag at 1 rad/sec is _ degrees 0 -45 -90 0-135 -180 225 270 325 -360 Asymptotic phase lag at 10 rad/sec is _ degrees 0 -45 -90 0 -135 -180 -225 -270 360 none of these Asymptotic phase...
Most questions answered within 3 hours.
-
The specific radiocarbon activity of a sample of wood is 6.25
gms dpm/gm of carbon. The...
asked 33 seconds from now -
An aqueous magnesium chloride solution is made by dissolving
6.96 moles of MgCl2 in sufficient water...
asked 1 minute ago -
Ken believes the average age of men who come to get a haircut at
his barber...
asked 24 minutes ago -
(Ratio Analysis): Last year Co. XYZ had sales of $ 400,000, with
“cost of goods sold”...
asked 32 minutes ago -
can someone please write the balanced chemical
equation for the synthesis of Bromoacetanilide
from;
aniline +...
asked 28 minutes ago -
1. If a corporation purchases land and building and subsequently
tears down the building and uses...
asked 39 minutes ago -
Consider a 23-year bond with 7 percent annual coupon payments.
The market rate (YTM) is 6.4...
asked 42 minutes ago -
a tuba creates a 4th harmonic of frequency 116.5 Hz. what is the
frequency of the...
asked 48 minutes ago -
A coconut mass 2kg falls from a 30m tall tree. The coconut falls
and comes to...
asked 52 minutes ago -
Group Policies
Research GROUP POLICY OBJECTS (GPO'S)
You can start in the Windows Server 2012 eBook...
asked 56 minutes ago -
software engineering
Problems.
Create a use case diagram for class registration for a
university.
Create a...
asked 55 minutes ago -
You are trying to convince your friend who wants to attend
medical school to take BY123...
asked 1 hour ago