


Homework Answers
Corresponding to 140 th observation, delay is 218 minutes.
Corresponding z-score is given by

Observation 140 in the data set shows a flight that was scheduled to leave at 6:45 PM but was delayed. The z-score for its departure delay is 3.558608, which means that the departure delay is 3.558608 standard deviation away from the mean. The departure delay for this observation can be considered an outlier, because it is more than 3 standard deviation away from the mean.
By Chebyshev's theorem we have,


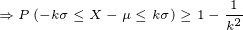
Taking  we get,
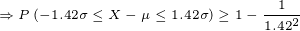

For any set of data, Chebyshev's theorem tells you that at least 50.40667% of the data values must lie within 1.42 standard deviations of the mean.
We have, 1.42 standard deviations about mean as

From the graph, we observe that frequency in this interval is approximately

From the graph, we observe that total frequency is approximately

So, fraction of data values in this interval is given by
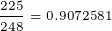
For the departure delays in this data set, 90.72581% of the values lie within 1.42 standard deviations of the mean. This is lesser than the proportion specified by Chebyshev's theorem.
When a data set has a symmetrical mound-shaped or bell-shaped distribution, the Empirical Rule tells you that 68.26895% of the data values will be within 1 standard deviation of the mean and 95.44997% will be within 2 standard deviation of the mean.
From the graph of data, we can conclude as follows.
The distribution of the departure delays is positively skewed (or right skewed). Therefore, the Empirical Rule may not hold for this distribution.
Add Answer to:
Departure Observation with Departure Times Date Departure Delay minutes WA JW, RW 136 Scheduled: 08:00; Actual:...
Question 10 (Use Data Set 15) a. Refer to Data Set 15- Flight Data, and use the departure delay t...
 Question 10 (Use Data Set 15) a. Refer to Data Set 15- Flight Data, and use the departure delay times and the arrival delay times to construct a scatterplot, find the value of the linear correlation coefficient r, and find either the P-value or the critical values of r using α-005. Determine whether there is sufficient evidence to support the claim of a linear correlation between the two variables. b. Use the departure delay times and the arrival delay times...
6. The sampling distribution of the sample proportion Aa Aa In 2007, about 14% of new-car purchas...
 6. The sampling distribution of the sample proportion Aa Aa In 2007, about 14% of new-car purchases in New York were financed with a home equity loan. [Source: "Auto Industry Feels the Pain of Tight Credit," The New York Times, May 27, 2008.] The ongoing process of new-car purchases in New York can be viewed as an infinite population Define p as the proportion of the population of new-car purchases in New York that are financed with a home equity...
6. The sampling distribution of the sample proportion Aa Aa In 2007, about 14% of new-car...
 6. The sampling distribution of the sample proportion Aa Aa In 2007, about 14% of new-car purchases in New York were financed with a home equity loan. [Source: "Auto Industry Feels the Pain of Tight Credit," The New York Times, May 27, 2008.] The ongoing process of new-car purchases in New York can be viewed as an infinite population Define p as the proportion of the population of new-car purchases in New York that are financed with a home equity...
6. The sampling distribution of the sample proportion In 2007, about 30% of new-car purchases in ...
 Please Help me to full the all
blank (11 blanks in total)
6. The sampling distribution of the sample proportion In 2007, about 30% of new-car purchases in California were financed with a home equity loan. [Source: "Auto Industry Feels the Pain of Tight Credit," The New York Times, May 27, 2008.] The ongoing process of new-car purchases in California can be viewed as an infinite population Define p as the proportion of the population of new-car purchases in California...
Please Help me to full the all
blank (11 blanks in total)
6. The sampling distribution of the sample proportion In 2007, about 30% of new-car purchases in California were financed with a home equity loan. [Source: "Auto Industry Feels the Pain of Tight Credit," The New York Times, May 27, 2008.] The ongoing process of new-car purchases in California can be viewed as an infinite population Define p as the proportion of the population of new-car purchases in California...
What kind of instruments were used in the study? Did it clearly link to the research...
 What kind of instruments were used in the study? Did it
clearly link to the research question? (One paragraph
minimum)
Page Organlzation of Hospital Nursing and 30-day Readmissions In Medicare Patlents Undergoing Surgery Chenjuan Ma, PhD National Database of Nursing Quality Indicators, University of Kansas School of Nursing 3901 Rainbow Bvd, M/S 3060 Kansas City, KS 66160, USA Matthew D McHugh, PhD, and Center for Heath Outcomes and Palcy Research University of Pennsyivania School of Nursing 418 Cune Bivd., Fagin...
What kind of instruments were used in the study? Did it
clearly link to the research question? (One paragraph
minimum)
Page Organlzation of Hospital Nursing and 30-day Readmissions In Medicare Patlents Undergoing Surgery Chenjuan Ma, PhD National Database of Nursing Quality Indicators, University of Kansas School of Nursing 3901 Rainbow Bvd, M/S 3060 Kansas City, KS 66160, USA Matthew D McHugh, PhD, and Center for Heath Outcomes and Palcy Research University of Pennsyivania School of Nursing 418 Cune Bivd., Fagin...
How can we assess whether a project is a success or a failure? This case presents...
 How can we assess whether a project is a success or a
failure?
This case presents two phases of a large business transformation project involving the implementation of an ERP system with the aim of creating an integrated company. The case illustrates some of the challenges associated with integration. It also presents the obstacles facing companies that undertake projects involving large information technology projects. Bombardier and Its Environment Joseph-Armand Bombardier was 15 years old when he built his first snowmobile...
How can we assess whether a project is a success or a
failure?
This case presents two phases of a large business transformation project involving the implementation of an ERP system with the aim of creating an integrated company. The case illustrates some of the challenges associated with integration. It also presents the obstacles facing companies that undertake projects involving large information technology projects. Bombardier and Its Environment Joseph-Armand Bombardier was 15 years old when he built his first snowmobile...
 Question 10 (Use Data Set 15) a. Refer to Data Set 15- Flight Data, and use the departure delay times and the arrival delay times to construct a scatterplot, find the value of the linear correlation coefficient r, and find either the P-value or the critical values of r using α-005. Determine whether there is sufficient evidence to support the claim of a linear correlation between the two variables. b. Use the departure delay times and the arrival delay times...
 6. The sampling distribution of the sample proportion Aa Aa In 2007, about 14% of new-car purchases in New York were financed with a home equity loan. [Source: "Auto Industry Feels the Pain of Tight Credit," The New York Times, May 27, 2008.] The ongoing process of new-car purchases in New York can be viewed as an infinite population Define p as the proportion of the population of new-car purchases in New York that are financed with a home equity...
 6. The sampling distribution of the sample proportion Aa Aa In 2007, about 14% of new-car purchases in New York were financed with a home equity loan. [Source: "Auto Industry Feels the Pain of Tight Credit," The New York Times, May 27, 2008.] The ongoing process of new-car purchases in New York can be viewed as an infinite population Define p as the proportion of the population of new-car purchases in New York that are financed with a home equity...
 Please Help me to full the all
blank (11 blanks in total)
6. The sampling distribution of the sample proportion In 2007, about 30% of new-car purchases in California were financed with a home equity loan. [Source: "Auto Industry Feels the Pain of Tight Credit," The New York Times, May 27, 2008.] The ongoing process of new-car purchases in California can be viewed as an infinite population Define p as the proportion of the population of new-car purchases in California...
Please Help me to full the all
blank (11 blanks in total)
6. The sampling distribution of the sample proportion In 2007, about 30% of new-car purchases in California were financed with a home equity loan. [Source: "Auto Industry Feels the Pain of Tight Credit," The New York Times, May 27, 2008.] The ongoing process of new-car purchases in California can be viewed as an infinite population Define p as the proportion of the population of new-car purchases in California...
 What kind of instruments were used in the study? Did it
clearly link to the research question? (One paragraph
minimum)
Page Organlzation of Hospital Nursing and 30-day Readmissions In Medicare Patlents Undergoing Surgery Chenjuan Ma, PhD National Database of Nursing Quality Indicators, University of Kansas School of Nursing 3901 Rainbow Bvd, M/S 3060 Kansas City, KS 66160, USA Matthew D McHugh, PhD, and Center for Heath Outcomes and Palcy Research University of Pennsyivania School of Nursing 418 Cune Bivd., Fagin...
What kind of instruments were used in the study? Did it
clearly link to the research question? (One paragraph
minimum)
Page Organlzation of Hospital Nursing and 30-day Readmissions In Medicare Patlents Undergoing Surgery Chenjuan Ma, PhD National Database of Nursing Quality Indicators, University of Kansas School of Nursing 3901 Rainbow Bvd, M/S 3060 Kansas City, KS 66160, USA Matthew D McHugh, PhD, and Center for Heath Outcomes and Palcy Research University of Pennsyivania School of Nursing 418 Cune Bivd., Fagin...
 How can we assess whether a project is a success or a
failure?
This case presents two phases of a large business transformation project involving the implementation of an ERP system with the aim of creating an integrated company. The case illustrates some of the challenges associated with integration. It also presents the obstacles facing companies that undertake projects involving large information technology projects. Bombardier and Its Environment Joseph-Armand Bombardier was 15 years old when he built his first snowmobile...
How can we assess whether a project is a success or a
failure?
This case presents two phases of a large business transformation project involving the implementation of an ERP system with the aim of creating an integrated company. The case illustrates some of the challenges associated with integration. It also presents the obstacles facing companies that undertake projects involving large information technology projects. Bombardier and Its Environment Joseph-Armand Bombardier was 15 years old when he built his first snowmobile...
Most questions answered within 3 hours.
-
Calculate the mass of p-dichlorobenzene (mm=147.00 g/mol) that
when dissolved in 125 ml cyclohexane (d=0.779 g/mol,...
asked 45 seconds ago -
A defibrillator is used during a heart attack to restore the
heart to its normal beating...
asked 4 minutes ago -
Describe how humans have affected the numerous pathways and
reservoirs in the carbon cycle that have...
asked 6 minutes ago -
Which of the following statements is true of a distribution
rollover (not a trustee-to-trustee transfer) from...
asked 8 minutes ago -
Matching: What are 4 fundamental activities in software
processes?
definition of the software function and operational...
asked 14 minutes ago -
University Printers has two service departments (Maintenance and
Personnel) and two operating departments (Printing and Developing)....
asked 29 minutes ago -
This journal deals with globalization and its economic effects.
US firms have almost no restrictions on...
asked 28 minutes ago -
A local greenhouse sells coffee-tree saplings. They price their
saplings based on the height of the...
asked 42 minutes ago -
Sleep: Assume the general population gets an
average of 7 hours of sleep per night. You...
asked 45 minutes ago -
Florence, who weighs 540 N, stands on a bathroom scale in an
elevator. What will she...
asked 37 minutes ago -
Estimate the amount of Canadians who are vegans accurate to
within 2% with a 91% confidence...
asked 42 minutes ago -
As two cars move toward each other, the speedometer of one car
reads 57.9 km/h while...
asked 43 minutes ago