1. Under any normal distribution of scores, what percentage of the total area falls A. between...
1. Under any normal distribution of scores, what percentage of the total area falls
A. between the mean (μ) and a score value that lies one standard deviation (1σ) above the mean?
B. between a score value that lies one standard deviation below the mean and a score value that lies one standard deviation above the mean?
C. between the mean and a score value that lies +2σ above the mean?
D. between a score value that lies −2σ below the mean and a score value that lies +2σ above the mean?
Homework Answers
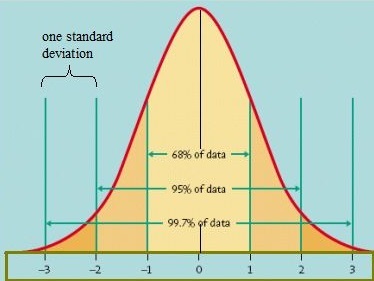
The empirical rule states that for a normal distribution, nearly all of the data will fall within three standard deviations of the mean. The empirical rule can be broken down into three parts:
- 68% of data falls within the first standard deviation from the mean.
- 95% fall within two standard deviations.
- 99.7% fall within three standard deviations.
The rule is also called the 68-95-99 7 Rule or the Three Sigma Rule.
A )
The percentage of the total area falls between the mean (μ) and a score value that lies one standard deviation (1σ) above the mean = 68 / 2 = 34%
B)
The percentage of the total area falls between a score value that lies one standard deviation below the mean and a score value that lies one standard deviation above the mean = 68%
C)
The percentage of the total area falls between the mean and a score value that lies +2σ above the mean = 95 / 2 = 47.5%
D)
The percentage of the total area falls between a score value that lies −2σ below the mean and a score value that lies +2σ above the mean = 95%
Add Answer to:
1. Under any normal distribution of scores, what percentage of
the total area falls
A. between...
6. Area under the normal distribution The following figure shows the normal distribution with the proportion...
 6. Area under the normal distribution The following figure shows the normal distribution with the proportion of the area under the normal curve contained within one, two, and three standard deviations of the mean. The last proportion on each side, 0.13%, depicts the remaining area under the curve. Specifically, 0.13% of the area under the standard normal distribution is located above z-score values greater than the mean (u) plus three standard deviations (+30). Also, because the normal distribution is symmetrical,...
4) Provide an appropriate response. 4) The area under the standard normal curve between 1 and...
 4) Provide an appropriate response. 4) The area under the standard normal curve between 1 and 2 is equal to 0.1359. Scores on a particular aptitude test are normally distributed with a mean of 100 and a standard deviation of 10. Which of the following are equal to 13.59%? a. The percentage of scores between 120 and 130 b. The percentage of scores between 110 and 120 c. The percentage of scores between 80 and 90 d. The percentage of...
1) Find the area under the standard normal curve to the right of z= -0.62. Round...
1) Find the area under the standard normal curve to the right of z= -0.62. Round your answer to four decimal places. 2) Find the following probability for the standard normal distribution. Round your answer to four decimal places. P( z < - 1.85) = 3) Obtain the following probability for the standard normal distribution. P(z<-5.43)= 4) Use a table, calculator, or computer to find the specified area under a standard normal curve. Round your answers to 4 decimal places....
To FOUR DECIMAL PLACES: Determine the area under the standard normal curve that lies to the...
To FOUR DECIMAL PLACES: Determine the area under the standard normal curve that lies to the left of Z = –1.31 to the right of Z = –2.47 between Z = –2.47 and Z = –1.31 between Z = 1.31 and Z = 2.47 Find the z-scores that separate the middle 84% of the standard normal distribution from the area in the tails. Find z0.18 a. Find the Z-score corresponding to the 72nd percentile. In other words, find the Z-score...
(1 point) Consider a normal distribution curve where the middle 90 % of the area under...
 (1 point) Consider a normal distribution curve where the middle 90 % of the area under the curve lies above the interval ( 3·11 ) Use this information to find the mean, μ , and the standard deviation, σ , of the distribution. Note: You can earn partial credit on this problem.
- What proportion of a normal distribution is located between each of the following Z-score boundaries?...
What proportion of a normal distribution is located between each of the following Z-score boundaries? a. z= -0.50 and z= +0.50 b. z=-0.90 and z= +0.90 c. z=-1.50 and z= 1.50 For a normal distribution with a mean of μ = 80 and a standard deviation of σ= 20, find the proportion of the population corresponding to each of the following. a. Scores greater than 85. b. Scores less than 100. c. Scores between 70 and 90. IQ test scores are standardized to produce a normal distribution with...
What percentage of the area under the normal curve falls between ±1, ±2, and ±3 standard...
What percentage of the area under the normal curve falls between ±1, ±2, and ±3 standard deviations? Illustrate it in a single curve. (0.5 Points)
Determine the area under the standard normal curve that lies between (a) Z=−1.72 and Z=1.72, (b)...
Determine the area under the standard normal curve that lies between (a) Z=−1.72 and Z=1.72, (b) Z=−2.89 and Z=0, and (c) Z=−0.43 and Z=0.96. Find the z-score such that the area under the standard normal curve to the left is 0.57. Find the z-score such that the area under the standard normal curve to the right is 0.11. The approximate z-score that corresponds to a right tail area of 0.11 is ___. Find the z-scores that separate the middle 31%...
1. A normal distribution of scores has a standard deviation of 10. Find the z-scores corresponding to...
1. A normal distribution of scores has a standard deviation of 10. Find the z-scores corresponding to each of the following values: a. A score that is 20 points above the mean. b. A score that is 10 points below the mean. c. A score that is 15 points above the mean. d. A score that is 30 points below the mean.
6. Properties of the normal curve Aa Aa The following figure shows the normal distribution with...
 6. Properties of the normal curve Aa Aa The following figure shows the normal distribution with the proportion of the area under the normal curve contained within one, two, and three standard deviations of the mean. The last proportion on each side, 0.13%, depicts the remaining area under the curve. Specifically, 0.13% of the area under the standard normal distribution is located above z-score values greater than the mean (H) plus three standard deviations (+30). Also, because the normal distribution...
 6. Area under the normal distribution The following figure shows the normal distribution with the proportion of the area under the normal curve contained within one, two, and three standard deviations of the mean. The last proportion on each side, 0.13%, depicts the remaining area under the curve. Specifically, 0.13% of the area under the standard normal distribution is located above z-score values greater than the mean (u) plus three standard deviations (+30). Also, because the normal distribution is symmetrical,...
 4) Provide an appropriate response. 4) The area under the standard normal curve between 1 and 2 is equal to 0.1359. Scores on a particular aptitude test are normally distributed with a mean of 100 and a standard deviation of 10. Which of the following are equal to 13.59%? a. The percentage of scores between 120 and 130 b. The percentage of scores between 110 and 120 c. The percentage of scores between 80 and 90 d. The percentage of...
 (1 point) Consider a normal distribution curve where the middle 90 % of the area under the curve lies above the interval ( 3·11 ) Use this information to find the mean, μ , and the standard deviation, σ , of the distribution. Note: You can earn partial credit on this problem.
 6. Properties of the normal curve Aa Aa The following figure shows the normal distribution with the proportion of the area under the normal curve contained within one, two, and three standard deviations of the mean. The last proportion on each side, 0.13%, depicts the remaining area under the curve. Specifically, 0.13% of the area under the standard normal distribution is located above z-score values greater than the mean (H) plus three standard deviations (+30). Also, because the normal distribution...
Most questions answered within 3 hours.
-
Consider the reaction, C3 H8 + O2 --> CO2 + H2O. How many
moles of O2...
asked 1 hour ago -
You and your opponent both roll a fair die. If you both roll the
same number,...
asked 1 hour ago -
In a study of the accuracy of fast food drive-through orders,
Restaurant A had 257 accurate...
asked 1 hour ago -
Identify and describe in detail the four categories of
institutions that could be included in a...
asked 1 hour ago -
In python
class Customer:
def __init__(self, customer_id, last_name, first_name, phone_number, address):
self._customer_id = int(customer_id)
self._last_name =...
asked 1 hour ago -
What is an example of a limitation in implementing a new
ERP system and how it...
asked 1 hour ago -
In a section of 9.7cm of an artery with a radius of 2.6mm there
is a...
asked 1 hour ago -
the two carboxylic acid groups of aspartic acid have different
acidities with pKa values of 2.1...
asked 1 hour ago -
Would CuCO3 aqueous salt combined with calcium chloride
form a solid precipitate? If so, what would...
asked 1 hour ago -
How do ECM Solutions assist in embedding a culture of continuous
improvement in an organization? (Project...
asked 2 hours ago -
Directions
These directions introduce the idea of Essential Questions.
Since this may be a new concept...
asked 2 hours ago -
1.b. Fiscal policy is said to suffer from ‘crowding out’.
Explain what this means and why...
asked 2 hours ago