
Homework Answers
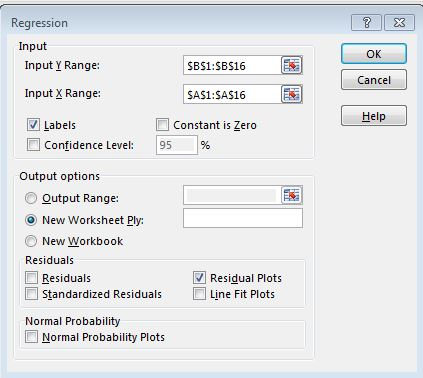
we can run the regression analysis in excel by going to data > data analysis tab and selecting regression


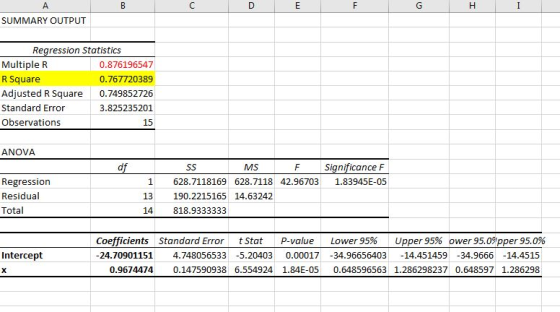
The r2 value is 0.7677
this means that the model is able to explain 76.77% varaition in the value of Y due to variation in the values of X
The correlation coefficient is
0.8761
hence this is a positive correlation on the higher side
please note that correlation can take values from -1 to 1 , with values near zero indicating weak correlation , negative values indicate a negative correlation
the residual plot is
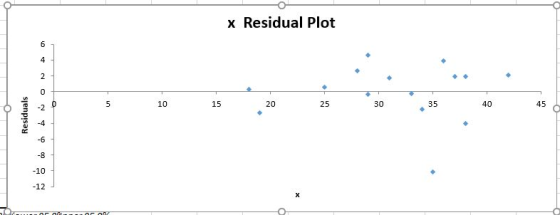
looks like some information is still left from the data to be extracted as the residuals form a wavy pattern , ideally we should not be able to see any pattern in the residual graph

There are 15 data points
hence the df is this case is
df = n-2 = 13
now we check the correlation table to check for the critical value
at df = 13 and alpha = 0.05
the value is 0.514 , please see the correlation table for this
as the correlation value is greater than this critical value hence we conclude that the correlation value is signficant
Add Answer to:
solve problems ( 8,9 &10)
Due on August 02, 2018 Name: Na Na Name: ID ID...
Attention: Due to 교 bug in Google Chrome, this page may not function correctly. Click her to lea...
 Attention: Due to 교 bug in Google Chrome, this page may not function correctly. Click her to learn more. 5. Comparing the fit of the regression lines for two sets of data Examine each of the following scatter diagrams and the corresponding regression lines. Identify which line better fits its data. Graph I Graph II 10 10 Next, calculate a measure of how close the data points are to the regression line. Following are the six pairs of data values...
Name Economics 5 Ch 13 Practice The follo wing data are the monthly salaries y and the grade point averages x for students who obtained a bachelor's degree in business administ ration Obser vatio...
 Name Economics 5 Ch 13 Practice The follo wing data are the monthly salaries y and the grade point averages x for students who obtained a bachelor's degree in business administ ration Obser vation index xi 2.6 3300 3.4 3600 3.6 4000 3.2 3500 3.5 3900 2.9 3600 TSS Totals SSR SSE 1. Calculate and y 2. Use the least squares method to develop the estimated regression equation. Use two decimal points in your answers for bo and bi. 3....
BBA 403 TEST 3: Name: Score:_ SOLVE AND THOROUGHLY INTERPRET YOUR ANSWER 1. A marketing manager conducted a study to determine whether there is a linear relationship between many spent on adverti...
 BBA 403 TEST 3: Name: Score:_ SOLVE AND THOROUGHLY INTERPRET YOUR ANSWER 1. A marketing manager conducted a study to determine whether there is a linear relationship between many spent on advertising and company sales. The data are shown on the table below. Display the data in a scatter plot, calculate the correlation coefficient, state a conclusion, and interpret the result Adverstising Company Expense, (1000s of s) (1000s of ) 2.4 16 2.0 26 14 1.6 2.0 2.2 184 220...
Place your answers on the templates provided. Show your work. Directions: 1. A doctor knows that muscle mass decreases with age. To help him understand this relationship in women, the doct...
 Place your answers on the templates provided. Show your work. Directions: 1. A doctor knows that muscle mass decreases with age. To help him understand this relationship in women, the doctor selected women beginning with age 40 and ending with age 80. The data is given in the table below. x is age, y is a measure of muscle mass (the higher the measure, the more muscle mass). Use your calculator to make a scatter plot that shows how age...
(Solve this problem manually.) Jensen Tire & Auto is in the process of deciding whether to pu...
(Solve this problem manually.) Jensen Tire & Auto is in the process of deciding whether to purchase a maintenance contract for its new computer wheel alignment and balancing machine. Managers feel that maintenance expense should be related to usage, and they collected the following information on weekly usage (hours) and annual maintenance expense (in hundreds of dollars): Weekly Usage (hours) Annual Maintenance Expense ($100) 17 17 20 30 28 40 32 38 18 31 24 32.5 42 41 35 45...
While conducting a one-way ANOVA comparing 6 treatments with 10 observations per treatment, the computed value for...
While conducting a one-way ANOVA comparing 6 treatments with 10 observations per treatment, the computed value for SS(Treatment)= 1, and SS(Error)=24. Calculate the value of F. Round off the answer to 2 decimal digits A study was conducted to determine the association between the maximum distance at which a highway sign can be read ( in feet) and the age of the driver ( in years). Fourty drivers of various ages were studied. The summary statistics for distance and age are...
1. Develop the simple linear regression equation to predict repair time given the number of months...
 1. Develop the simple linear regression equation to predict
repair time given the number of months since
the last maintenance service, and use the results to check the
conditions necessary for valid inference in
regression, and to test the hypothesis that no relationship exists
between repair time and the number of
months since the last maintenance service at the 0.05 level of
significance. What is the interpretation of
this relationship? What does the coefficient of determination tell
you about this...
1. Develop the simple linear regression equation to predict
repair time given the number of months since
the last maintenance service, and use the results to check the
conditions necessary for valid inference in
regression, and to test the hypothesis that no relationship exists
between repair time and the number of
months since the last maintenance service at the 0.05 level of
significance. What is the interpretation of
this relationship? What does the coefficient of determination tell
you about this...
Problem 1 Please do not use any type of software to solve this problem; perform all...
 Problem 1 Please do not use any type of software to solve this problem; perform all the calculations and draw the charts by hand. You can use your calculator only for simple operations like addition, multiplication, finding averages and standard deviations. The owner of an apartment complex with three-bedroom units is trying to determine what rent he should set for the summer months. He believes that the rent of an apartment in his complex determines if it will be occupied...
Assignment 10 1. A random sample of 37 drivers insured with a company having similar auto...
 Assignment 10 1. A random sample of 37 drivers insured with a company having similar auto insurance policies) was selected The data table lists each of the driver's driving experience in years (DU), and their monthly auto insurance pre- miums in dollars (CU). A researcher wished to determine the following: Correlation: Experience (yrs) 1. On an a priori basis, would the researcher expect a positive or negative inverse) relationship between years driving experience and monthly insurance pre- miums? 4 4...
To be done on excel: Team Revenue ($ millions) Value ($ millions) Arizona Diamondbacks 195 584...
To be done on excel: Team Revenue ($ millions) Value ($ millions) Arizona Diamondbacks 195 584 Atlanta Braves 225 629 Baltimore Orioles 206 618 Boston Red Sox 336 1,312 Chicago Cubs 274 1,000 Chicago White Sox 216 692 Cincinnati Reds 202 546 Cleveland Indians 186 559 Colorado Rockies 199 537 Detroit Tigers 238 643 Houston Astros 196 626 Kansas City Royals 169 457 Los Angeles Angels of Anaheim 239 718 Los Angeles Dodgers 245 1,615 Miami Marlins 195 520 Milwaukee...
 Attention: Due to 교 bug in Google Chrome, this page may not function correctly. Click her to learn more. 5. Comparing the fit of the regression lines for two sets of data Examine each of the following scatter diagrams and the corresponding regression lines. Identify which line better fits its data. Graph I Graph II 10 10 Next, calculate a measure of how close the data points are to the regression line. Following are the six pairs of data values...
 Name Economics 5 Ch 13 Practice The follo wing data are the monthly salaries y and the grade point averages x for students who obtained a bachelor's degree in business administ ration Obser vation index xi 2.6 3300 3.4 3600 3.6 4000 3.2 3500 3.5 3900 2.9 3600 TSS Totals SSR SSE 1. Calculate and y 2. Use the least squares method to develop the estimated regression equation. Use two decimal points in your answers for bo and bi. 3....
 BBA 403 TEST 3: Name: Score:_ SOLVE AND THOROUGHLY INTERPRET YOUR ANSWER 1. A marketing manager conducted a study to determine whether there is a linear relationship between many spent on advertising and company sales. The data are shown on the table below. Display the data in a scatter plot, calculate the correlation coefficient, state a conclusion, and interpret the result Adverstising Company Expense, (1000s of s) (1000s of ) 2.4 16 2.0 26 14 1.6 2.0 2.2 184 220...
 Place your answers on the templates provided. Show your work. Directions: 1. A doctor knows that muscle mass decreases with age. To help him understand this relationship in women, the doctor selected women beginning with age 40 and ending with age 80. The data is given in the table below. x is age, y is a measure of muscle mass (the higher the measure, the more muscle mass). Use your calculator to make a scatter plot that shows how age...
 1. Develop the simple linear regression equation to predict
repair time given the number of months since
the last maintenance service, and use the results to check the
conditions necessary for valid inference in
regression, and to test the hypothesis that no relationship exists
between repair time and the number of
months since the last maintenance service at the 0.05 level of
significance. What is the interpretation of
this relationship? What does the coefficient of determination tell
you about this...
1. Develop the simple linear regression equation to predict
repair time given the number of months since
the last maintenance service, and use the results to check the
conditions necessary for valid inference in
regression, and to test the hypothesis that no relationship exists
between repair time and the number of
months since the last maintenance service at the 0.05 level of
significance. What is the interpretation of
this relationship? What does the coefficient of determination tell
you about this...
 Problem 1 Please do not use any type of software to solve this problem; perform all the calculations and draw the charts by hand. You can use your calculator only for simple operations like addition, multiplication, finding averages and standard deviations. The owner of an apartment complex with three-bedroom units is trying to determine what rent he should set for the summer months. He believes that the rent of an apartment in his complex determines if it will be occupied...
 Assignment 10 1. A random sample of 37 drivers insured with a company having similar auto insurance policies) was selected The data table lists each of the driver's driving experience in years (DU), and their monthly auto insurance pre- miums in dollars (CU). A researcher wished to determine the following: Correlation: Experience (yrs) 1. On an a priori basis, would the researcher expect a positive or negative inverse) relationship between years driving experience and monthly insurance pre- miums? 4 4...
Most questions answered within 3 hours.
-
The average length of time between arrivals at a turnpike
toll-booth is 26 seconds. What is...
asked 23 minutes ago -
(a) A piston at 6.1 atm contains a gas that occupies a volume of
3.5 L....
asked 1 hour ago -
Please answer true or false. Words
cannot be changed or added in to make it true...
asked 1 hour ago -
An empty test tube weighs 15.923 grams. Then,
MgCl2•6H2O is added into the test tube. After...
asked 1 hour ago -
Assume memory access is 10 units of time and disk access is
10000 units of time....
asked 1 hour ago -
1. Are all good samples random?
2. Magazines often report surveys giving statistics such as “63%...
asked 2 hours ago -
Under all the various types of market structures, firms
must eventually earn some economic profits for...
asked 2 hours ago -
Consider the following fitness regime for a single locus trait
with two co-dominant alleles: w11 =...
asked 2 hours ago -
A large cable company reports the following.
80% of its customers subscribe to its cable TV...
asked 2 hours ago -
Please answer the question in brief.
Discuss the role of ERP in organizations. Are ERP tools...
asked 2 hours ago -
Discuss the pros and cons of collaborative software such
as SameTime. Does it increase productivity? What...
asked 2 hours ago -
Buying your in-laws a gift because it’s expected is
due to the ____________ motive of gift-giving....
asked 2 hours ago