How many separate peaks would be observed in the 13C spectra of the following compounds? a. 1,2-dinitrobenzene b. 1,3-dinitrobenzene c. 1,4-dinitrobenzene
1. How many separate peaks would be observed in the 13C spectra of the following compounds?
a. 1,2-dinitrobenzene b. 1,3-dinitrobenzene c. 1,4-dinitrobenzene
Solvent peaks typically appear at 0 ppm or 7.24 ppm.
Homework Answers

Add Answer to:
How many separate peaks would be observed in the 13C spectra of the following compounds? a. 1,2-dinitrobenzene b. 1,3-dinitrobenzene c. 1,4-dinitrobenzene
Propose structures for the following isomeric alcohols that give the 13C NMR spectra below. Assign the carbons to their respective peaks.
 Propose structures for the following isomeric alcohols that give the 13C NMR spectra below. Assign the carbons to their respective peaks.1d page 2.jpg1d page 3.jpg1d page 1.jpg09 13C shift chart 304.pdf
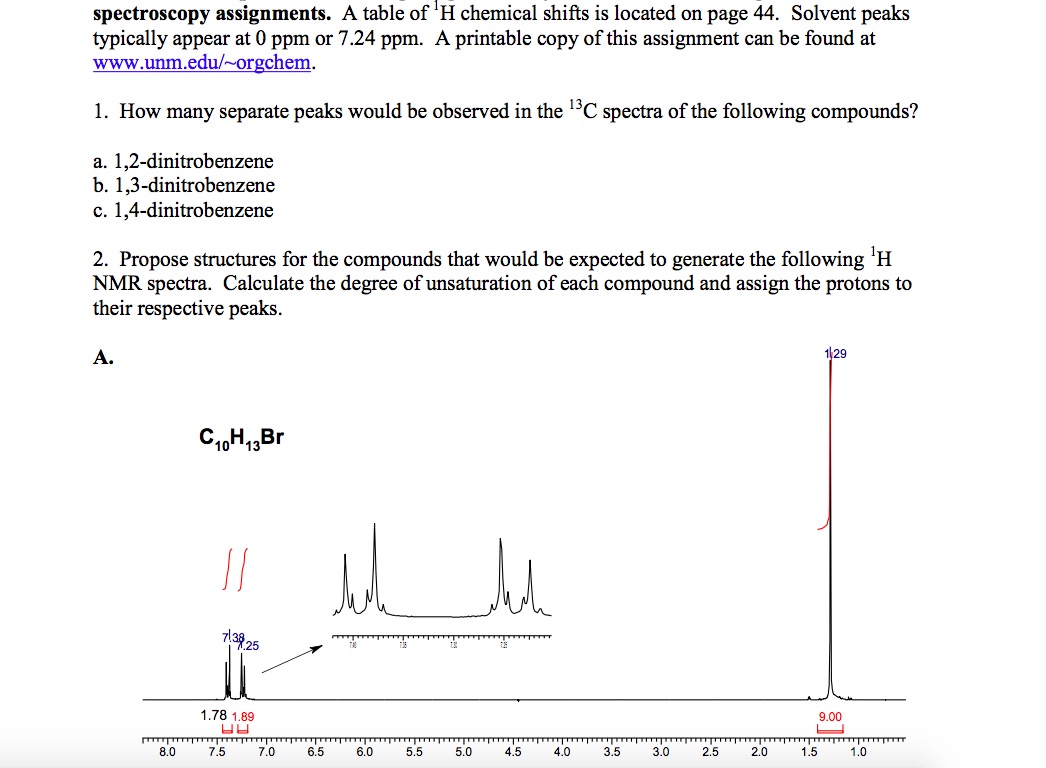
Propose structures for the compounds that would be expected to generate the following 1H NMR spectra. Calculate the degree of unsaturation of each compound and assign the protons to their respective peaks.
 2) Propose structures for the compounds that would be expected to generate the following 1H NMR spectra. Calculate the degree of unsaturation of each compound and assign the protons to their respective peaks.010 1H shift chart 304.pdf
Propose structures for the following isomeric alcohols that give the 13C NMR spectra below. Assign the carbons to their respective peaks. A table of chemical shifts is located on page 43.
Propose structures for the following isomeric alcohols that give the 13C NMR spectra below. Assign the carbons to their respective peaks. A table of chemical shifts is located on page 43.09 13C shift chart 304.pdf
for the following 2 compounds, please calculate, and show the calculations for, the degree of unsaturation, assign the IR spectrum peaks, assign the 13C NMR peaks, assign the 1H NMR peaks, and draw th...
 for the following 2 compounds, please calculate, and
show the calculations for, the degree of unsaturation, assign the
IR spectrum peaks, assign the 13C NMR peaks, assign the 1H NMR
peaks, and draw the structure for the unknown compound.
CHIM 245 Spectroscopy Problem Set #2 In this problem set there are two unknown compounds. You are provided with the formula, IR spectrum, "C NMR spectrum, and 'H NMR spectrum for each compound. Each unknown is worth 10 points, with an...
for the following 2 compounds, please calculate, and
show the calculations for, the degree of unsaturation, assign the
IR spectrum peaks, assign the 13C NMR peaks, assign the 1H NMR
peaks, and draw the structure for the unknown compound.
CHIM 245 Spectroscopy Problem Set #2 In this problem set there are two unknown compounds. You are provided with the formula, IR spectrum, "C NMR spectrum, and 'H NMR spectrum for each compound. Each unknown is worth 10 points, with an...
PART 1 - For the following compounds A. Predict how many signals would be detected in...
 PART 1 - For the following compounds A. Predict how many signals would be detected in the expected 'H NMR spectrum. B. Label proton groups and determine their multiplicity. c. Predict the chemical shifts of each signal in the expected 'H NMR spectrum of the following compounds from the correlation chart in the last page. <Example> Number of signals O Proton groups Multiplicity Triplet B Multiplet (sextet) c Triplet D Singlet Chemical Shirt (ppm) 0.8-1.0 1.2 - 1.5 3.2 4.0...
Evaluate and investigate the following IR Spectrum, 13C NMR Spectrum and 1H NMR Spectrum. Identify the most important peaks and correlate the results as much as you can from the obtained product in th...
 Evaluate and investigate the
following IR Spectrum, 13C NMR Spectrum
and 1H NMR Spectrum. Identify
the most important peaks and correlate the
results as much as you can from the obtained product in
the multi-step synthesis of ethyl acetoacetate.
This is Product E from this multi-step synthesis
where Product C was identified as in the figure
below and as such, identify what product can be obtained
after the synthesis from the spectra provided. Use the template
below in analysing the...
Evaluate and investigate the
following IR Spectrum, 13C NMR Spectrum
and 1H NMR Spectrum. Identify
the most important peaks and correlate the
results as much as you can from the obtained product in
the multi-step synthesis of ethyl acetoacetate.
This is Product E from this multi-step synthesis
where Product C was identified as in the figure
below and as such, identify what product can be obtained
after the synthesis from the spectra provided. Use the template
below in analysing the...
 for the following 2 compounds, please calculate, and
show the calculations for, the degree of unsaturation, assign the
IR spectrum peaks, assign the 13C NMR peaks, assign the 1H NMR
peaks, and draw the structure for the unknown compound.
CHIM 245 Spectroscopy Problem Set #2 In this problem set there are two unknown compounds. You are provided with the formula, IR spectrum, "C NMR spectrum, and 'H NMR spectrum for each compound. Each unknown is worth 10 points, with an...
for the following 2 compounds, please calculate, and
show the calculations for, the degree of unsaturation, assign the
IR spectrum peaks, assign the 13C NMR peaks, assign the 1H NMR
peaks, and draw the structure for the unknown compound.
CHIM 245 Spectroscopy Problem Set #2 In this problem set there are two unknown compounds. You are provided with the formula, IR spectrum, "C NMR spectrum, and 'H NMR spectrum for each compound. Each unknown is worth 10 points, with an...
 PART 1 - For the following compounds A. Predict how many signals would be detected in the expected 'H NMR spectrum. B. Label proton groups and determine their multiplicity. c. Predict the chemical shifts of each signal in the expected 'H NMR spectrum of the following compounds from the correlation chart in the last page. <Example> Number of signals O Proton groups Multiplicity Triplet B Multiplet (sextet) c Triplet D Singlet Chemical Shirt (ppm) 0.8-1.0 1.2 - 1.5 3.2 4.0...
 Evaluate and investigate the
following IR Spectrum, 13C NMR Spectrum
and 1H NMR Spectrum. Identify
the most important peaks and correlate the
results as much as you can from the obtained product in
the multi-step synthesis of ethyl acetoacetate.
This is Product E from this multi-step synthesis
where Product C was identified as in the figure
below and as such, identify what product can be obtained
after the synthesis from the spectra provided. Use the template
below in analysing the...
Evaluate and investigate the
following IR Spectrum, 13C NMR Spectrum
and 1H NMR Spectrum. Identify
the most important peaks and correlate the
results as much as you can from the obtained product in
the multi-step synthesis of ethyl acetoacetate.
This is Product E from this multi-step synthesis
where Product C was identified as in the figure
below and as such, identify what product can be obtained
after the synthesis from the spectra provided. Use the template
below in analysing the...
Most questions answered within 3 hours.
-
Six years of quarterly data of a seasonally adjusted series are
used to estimate a linear...
asked 16 minutes ago -
Which of the following is not an ecological model used
to foster behavior change?
PRECEDE-PROCEED Model...
asked 19 minutes ago -
On the Apollo 14 mission to the moon, astronaut Alan Shepard hit
a golf ball with...
asked 15 minutes ago -
What are John’s potential claims if he is terminated
this week?
John is a 54-year-old man...
asked 28 minutes ago -
A (8.5) cm tall object is placed at a distance of (14.2) cm from
a convex...
asked 37 minutes ago -
(2) For the following questions, consider a data set that
exhibits a normal distribution. Report the...
asked 38 minutes ago -
What exactly is an information system? How does it work" What
are its people organization,
...
asked 39 minutes ago -
The Food Marketing Institute shows that 17% of households spend
more than $100 per week on...
asked 49 minutes ago -
Go to NCBI BLAST search web page
1st search: GEKDLRRAKDINQEVYNF
2nd search: PTSQRLQLLEPFDK
3rd search: GEKDLRRAKDINQEVYNF...
asked 52 minutes ago -
Explain how each of the following three conditions could be a
red flag for a register...
asked 57 minutes ago -
In a two-way factorial ANOVA, the final F-ratio for
factor AxB is determined by dividing _____...
asked 1 hour ago -
Show your solutions for answer.
4. An aqueous solution contains 9.21 g of
K4Fe(CN)6 in a...
asked 57 minutes ago