3. As we have seen in class, hypothesis testing, and confidence intervals are the most common inferential tools used in statistics. Imagine that you have been tasked with designing an experiment to determine reliably if a patient should be diagnosed with diabetes based on their blood test results. Create a short outline of your experiment, including all the following:
a. A detailed discussion of your experimental design. Detailed experimental design should include the type of experiment, how you chose your sample size, what data is being collected, and how you would collect that data.
b. How is randomization used in your sampling or assignment strategy? Remember to discuss how you would randomize for sampling and assignment, what type of randomization are you using?
c. The type of inferential test utilized in your experiment. Include type of test used, number of tails, and a justification for this choice.
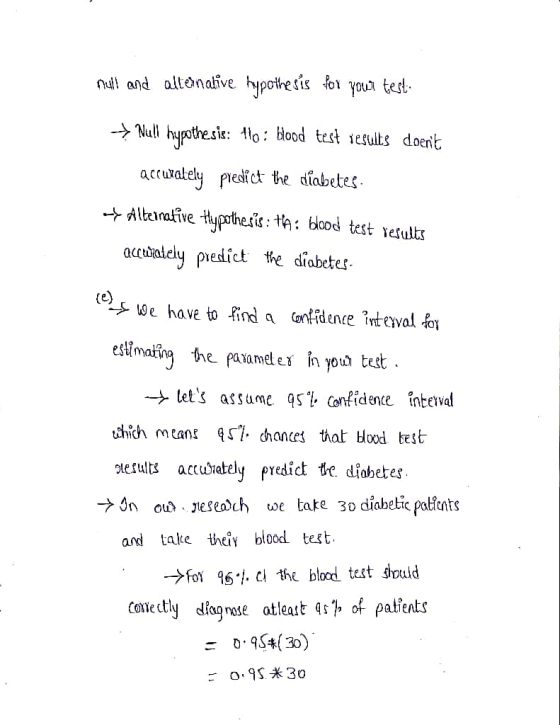
d. A formal statement of the null and alternative hypothesis for your test. Make sure to include correct statistical notation for the formal null and alternative, do not just state this in words.
e. A confidence interval for estimating the parameter in your test. State and discuss your chosen confidence level, why this is appropriate, and interpret the lower and upper limits.
f. An interpretation of your p-value and confidence interval, including what they mean in the context of your experimental design. Answer each part below. State your significance level, interpret your p-value, and make a decision on the null.

Homework Answers

 NOTE: If you satisfy with this
solution please give me a thumb up. Thank-you :)
NOTE: If you satisfy with this
solution please give me a thumb up. Thank-you :)
Add Answer to:
3. As we have seen in class, hypothesis testing, and confidence
intervals are the most common...
3. As we have seen in class, hypothesis testing and confidence intervals are the most common...
3. As we have seen in class, hypothesis testing and confidence intervals are the most common inferential tools used in statistics. Imagine that you have been tasked with designing an experiment to determine reliably if a patient should be diagnosed with diabetes based on their blood test results. Create a short outline of your experiment, including all of the following: A detailed discussion of your experimental design. How is randomization used in your sampling or assignment strategy? The type of...
Hypothesis testing and confidence intervals are the most common inferential tools used in statistics. Imagine that...
Hypothesis testing and confidence intervals are the most common inferential tools used in statistics. Imagine that you have been tasked with designing an experiment to determine reliably if a patient should be diagnosed with diabetes based on their blood test results. Create a short outline of your experiment, including all of the following: a) A detailed discussion of your experimental design. b) How is randomization used in your sampling or assignment strategy? c) The type of inferential test utilized in...
Research is an integral part of all professional fields. Designing a research study can be a...
Research is an integral part of all professional fields. Designing a research study can be a complicated task that can be simplified if the appropriate techniques can be identified. This assignment will give you the opportunity to design an experiment, including finding relevant prior research, determining the appropriate sample, data analysis techniques, and discuss the results you hope to see. Working from the topic chosen earlier in the topic selection, you will be designing your own statistical study. In a...
O CONFIDENCE INTERVALS AND HYPOTHESIS TESTING Hypothesis test for a population proportion Lau A decade-old study...
 O CONFIDENCE INTERVALS AND HYPOTHESIS TESTING Hypothesis test for a population proportion Lau A decade-old study found that the proportion, p, of high school seniors who beleved that "getting rich" was an important personal goal was 70%. A researcher decides to test whether or not that percentage still stands. He finds that, among the 220 high school seniors in his random sample, 135 beleve that "getting rich" is an important goal. Can he conclude, at the 0.1 level of significance,...
Confidence interval and hypothesis testing are commonly used in business (and other fields) to make decision(s)...
Confidence interval and hypothesis testing are commonly used in business (and other fields) to make decision(s) from data. For this assignment, find a journal or article that have used confidence interval(s) and/or hypothesis test(s) to make decision(s) or conclusion(s). In your post, include: (a) a brief summary of the journal/article; (b) how confidence interval(s) or hypothesis test(s) were used; and (c) decision(s) and/or conclusion(s). Be sure to cite the journal/article you've used. For peer responses, discuss the similarities and/or differences...
To be done on Anova (or not) State the hypothesis that we are testing in this...
 To be done on Anova (or not)
State the hypothesis that we are testing in this problem.
Set up the null and alternative.
Comment on the degree of freedom values for each source of
variation. How do you calculate them?
Do we reject the hypothesis that we are testing? Why or why
not?
If you reject, can you tell which level(s) is probably the
one(s) that has the different mean? (Hint: use the box plots from
part 1a
Use the...
To be done on Anova (or not)
State the hypothesis that we are testing in this problem.
Set up the null and alternative.
Comment on the degree of freedom values for each source of
variation. How do you calculate them?
Do we reject the hypothesis that we are testing? Why or why
not?
If you reject, can you tell which level(s) is probably the
one(s) that has the different mean? (Hint: use the box plots from
part 1a
Use the...
Follow the instructions below for the remaining questions (on page 2) For Confidence Intervals you must...
 Follow the instructions below for the remaining questions (on page 2) For Confidence Intervals you must state each of the following: The estimate The margin of error An indication of how you used your technology (StatCrunch) for these calculations. A complete sentence that includes the confidence level explaining your result in context. For Hypothesis Tests you must include the 4 steps: Hypothesize (write the null and alternative hypotheses using correct notation) Prepare: Indicate the significance level a (usually given) and...
10) (a) In a hypothesis testing procedure explain the difference between a type 1 and type...
10) (a) In a hypothesis testing procedure explain the difference between a type 1 and type 2 error (b) Explain the difference between a point estimate and an interval estimate? What is a confidence interval? (c) A poll service indicates that 74% of the public is opposed to a certain piece of legislation but there is a 95% margin of sampling error of 3.1%. Express these findings as a confidence interval. (d) You read in the paper that in a...
On your first day on the job, your boss asks you to conduct a hypothesis test...
On your first day on the job, your boss asks you to conduct a hypothesis test about the mean dwell time of a new type of UAV. Before you arrived, an experiment was conducted on ? = 5 UAVs (all of the new type) resulting in a sample mean dwell time of ?1 = 10.4 h????. The goal is to conclusively demonstrate, if possible, that the data supports the manufacturer’s claim that the mean dwell time is greater than 10...
Right side Hypothesis Testing 03 (two independent samples 3. Two different formulations of ormulations of an...
 Right side Hypothesis Testing 03 (two independent samples 3. Two different formulations of ormulations of an Oxygenated motor fuel are being tested to study their road Varance of road octane number for formulation 1. 1.5 and for forma sample of size n = 15 and n = 20 are tested, and the mean road octane 12 = 92.5. Assume Normality. motor fuel are being tested to study their road octane numbers. The 1.5 and for formulation 2 It is of...
 O CONFIDENCE INTERVALS AND HYPOTHESIS TESTING Hypothesis test for a population proportion Lau A decade-old study found that the proportion, p, of high school seniors who beleved that "getting rich" was an important personal goal was 70%. A researcher decides to test whether or not that percentage still stands. He finds that, among the 220 high school seniors in his random sample, 135 beleve that "getting rich" is an important goal. Can he conclude, at the 0.1 level of significance,...
 To be done on Anova (or not)
State the hypothesis that we are testing in this problem.
Set up the null and alternative.
Comment on the degree of freedom values for each source of
variation. How do you calculate them?
Do we reject the hypothesis that we are testing? Why or why
not?
If you reject, can you tell which level(s) is probably the
one(s) that has the different mean? (Hint: use the box plots from
part 1a
Use the...
To be done on Anova (or not)
State the hypothesis that we are testing in this problem.
Set up the null and alternative.
Comment on the degree of freedom values for each source of
variation. How do you calculate them?
Do we reject the hypothesis that we are testing? Why or why
not?
If you reject, can you tell which level(s) is probably the
one(s) that has the different mean? (Hint: use the box plots from
part 1a
Use the...
 Follow the instructions below for the remaining questions (on page 2) For Confidence Intervals you must state each of the following: The estimate The margin of error An indication of how you used your technology (StatCrunch) for these calculations. A complete sentence that includes the confidence level explaining your result in context. For Hypothesis Tests you must include the 4 steps: Hypothesize (write the null and alternative hypotheses using correct notation) Prepare: Indicate the significance level a (usually given) and...
 Right side Hypothesis Testing 03 (two independent samples 3. Two different formulations of ormulations of an Oxygenated motor fuel are being tested to study their road Varance of road octane number for formulation 1. 1.5 and for forma sample of size n = 15 and n = 20 are tested, and the mean road octane 12 = 92.5. Assume Normality. motor fuel are being tested to study their road octane numbers. The 1.5 and for formulation 2 It is of...
Most questions answered within 3 hours.
-
(Ratio Analysis): Last year Co. XYZ had sales of $ 400,000, with
“cost of goods sold”...
asked 3 minutes ago -
1. If a corporation purchases land and building and subsequently
tears down the building and uses...
asked 10 minutes ago -
Consider a 23-year bond with 7 percent annual coupon payments.
The market rate (YTM) is 6.4...
asked 13 minutes ago -
a tuba creates a 4th harmonic of frequency 116.5 Hz. what is the
frequency of the...
asked 19 minutes ago -
A coconut mass 2kg falls from a 30m tall tree. The coconut falls
and comes to...
asked 22 minutes ago -
Group Policies
Research GROUP POLICY OBJECTS (GPO'S)
You can start in the Windows Server 2012 eBook...
asked 26 minutes ago -
software engineering
Problems.
Create a use case diagram for class registration for a
university.
Create a...
asked 26 minutes ago -
You are trying to convince your friend who wants to attend
medical school to take BY123...
asked 41 minutes ago -
Subject: C++
I have created a class called QueueOfIntegers in a file called
QueueOfIntegers.h, which is...
asked 41 minutes ago -
calculate the number of molecules of gas in a
container of 2.0 liter at 30 degrees...
asked 58 minutes ago -
1.which of the following is a phototroph?
a. sulfolobus
b. chloroflexus
c. bacteroidetes
d. deinococcus radioduran...
asked 54 minutes ago -
The group of companies LC "High-precision measuring instruments"
is the global provider of measurement, analysis and...
asked 1 hour ago